. 2017 Jun 1;36(22):3104-3118.
doi: 10.1038/onc.2016.460. Epub 2017 Jan 9.

Role of Akt2 in regulation of metastasis suppressor 1 expression and colorectal cancer metastasis

Affiliations

Role of Akt2 in regulation of metastasis suppressor 1 expression and colorectal cancer metastasis

E Agarwal et al. Oncogene. .

Abstract

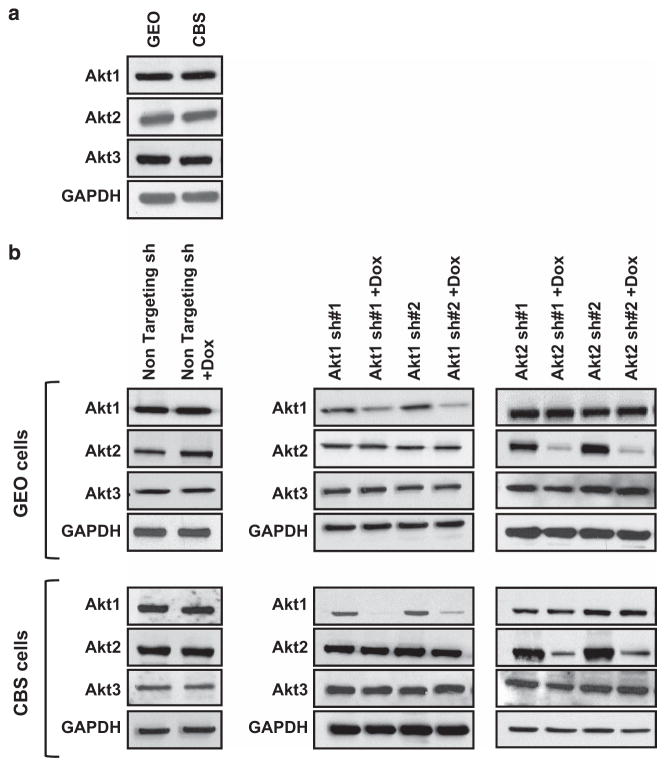
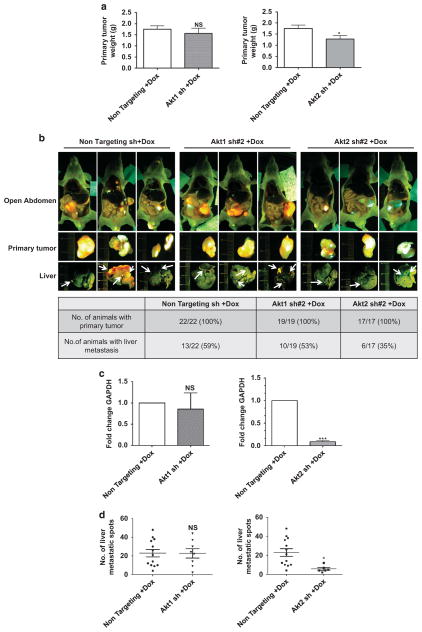
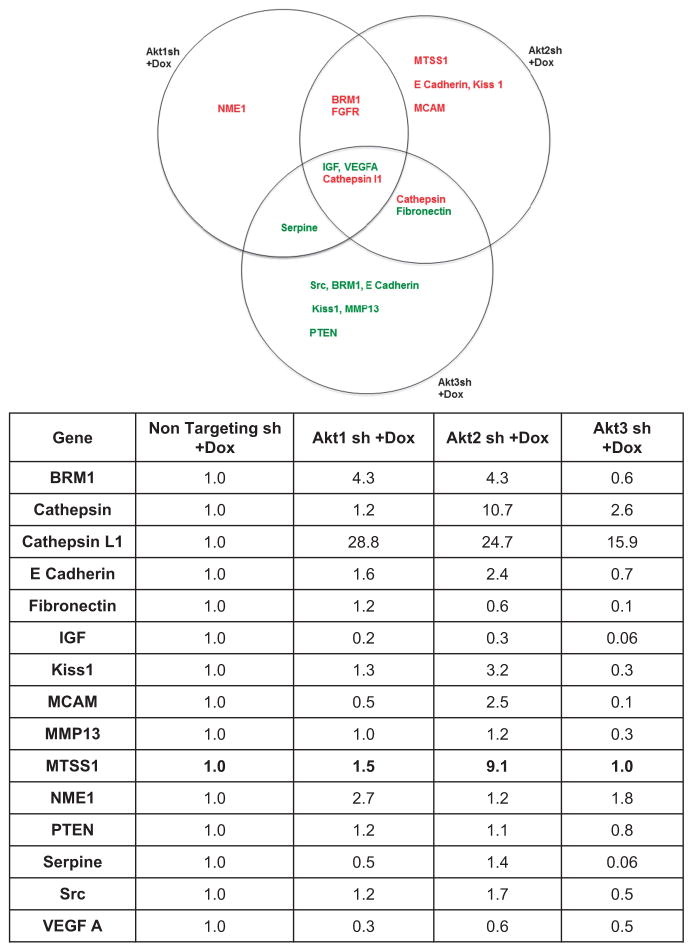
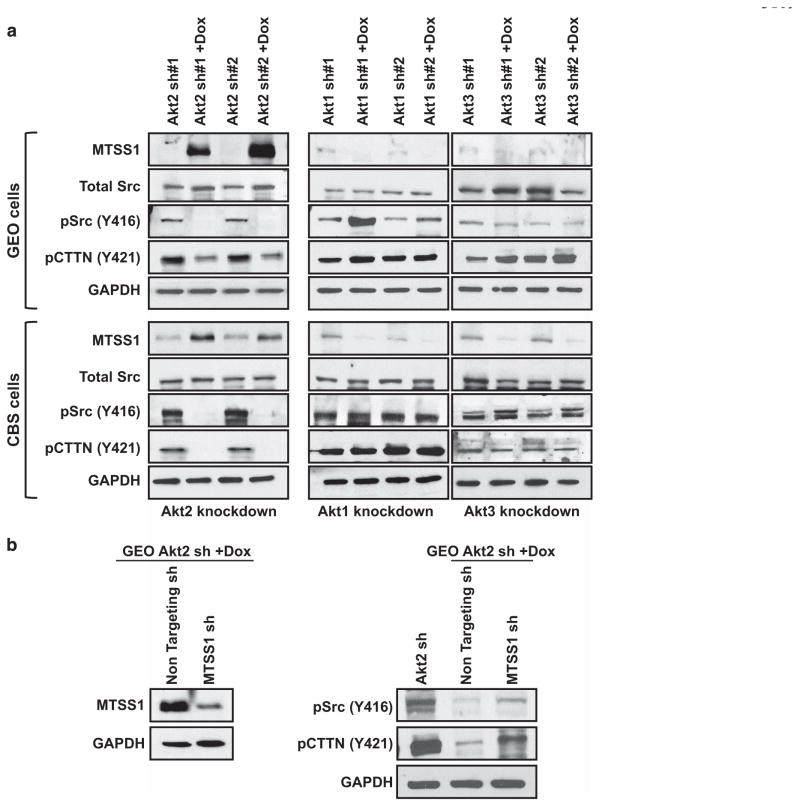
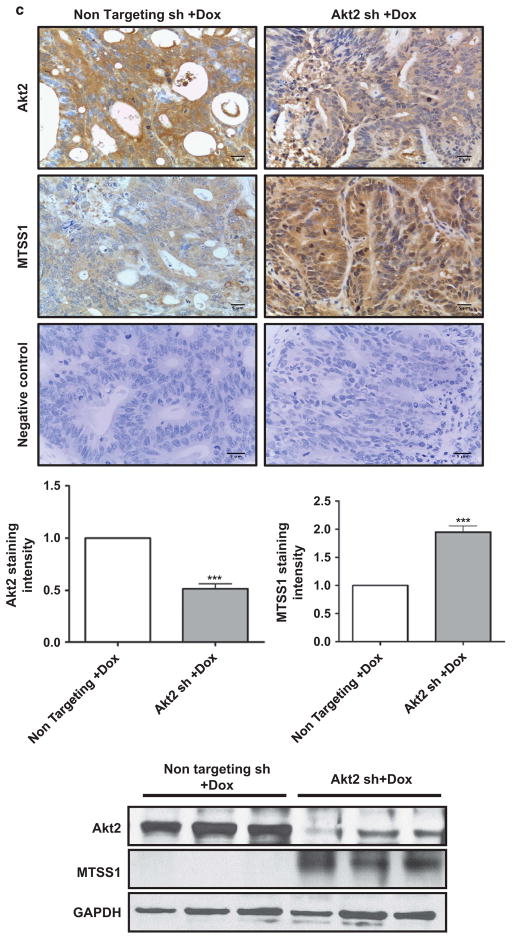
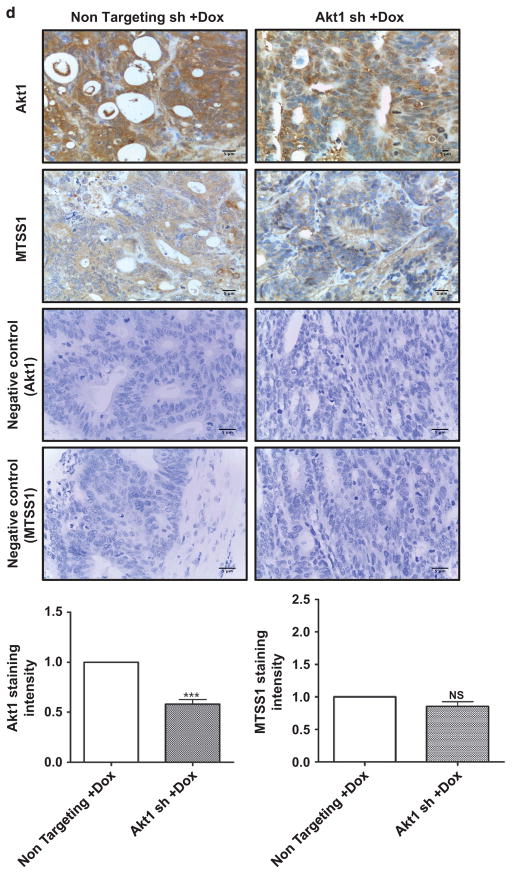
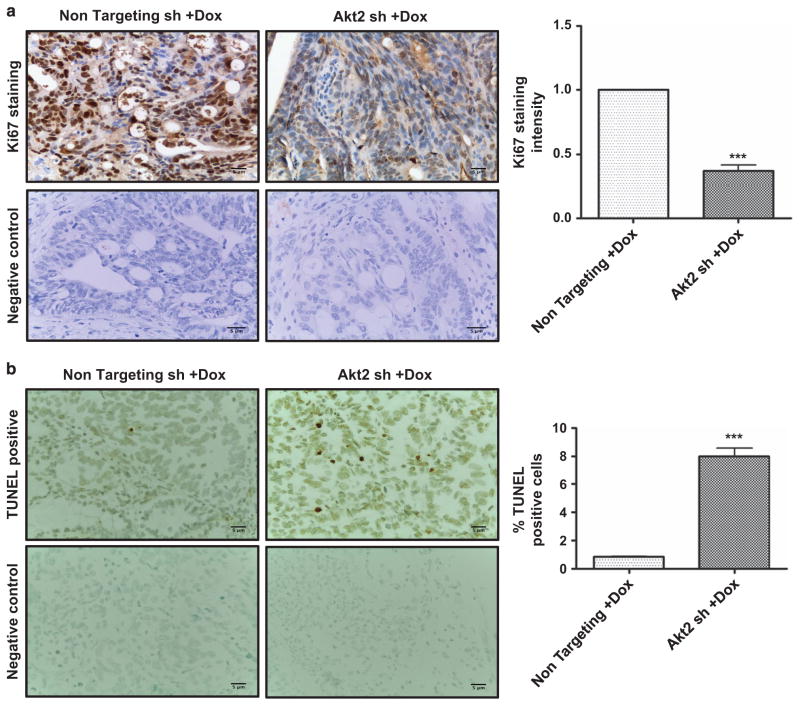
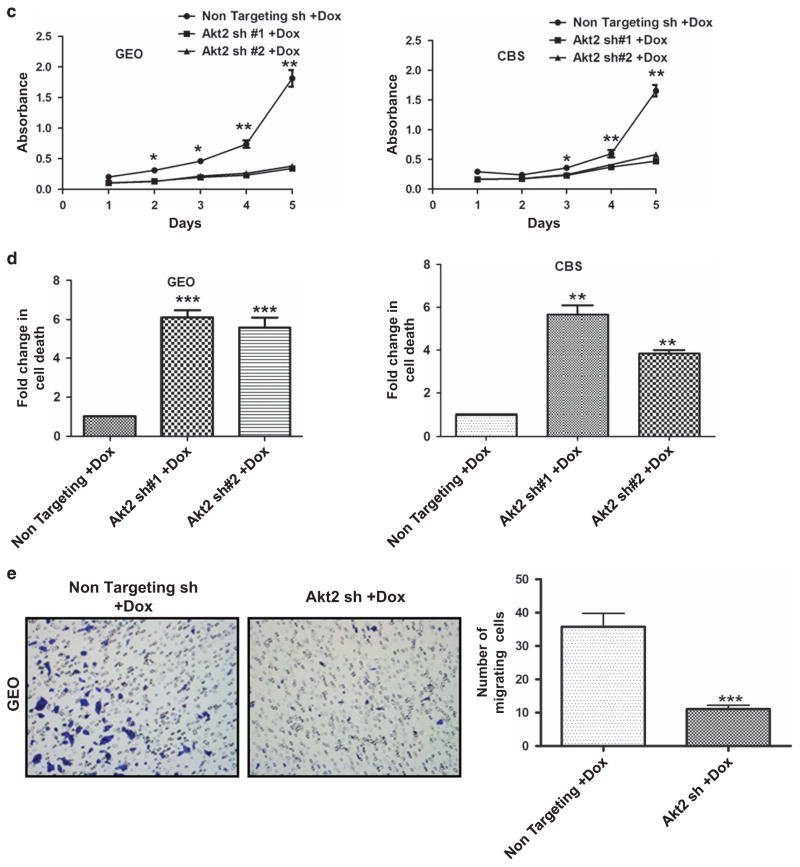
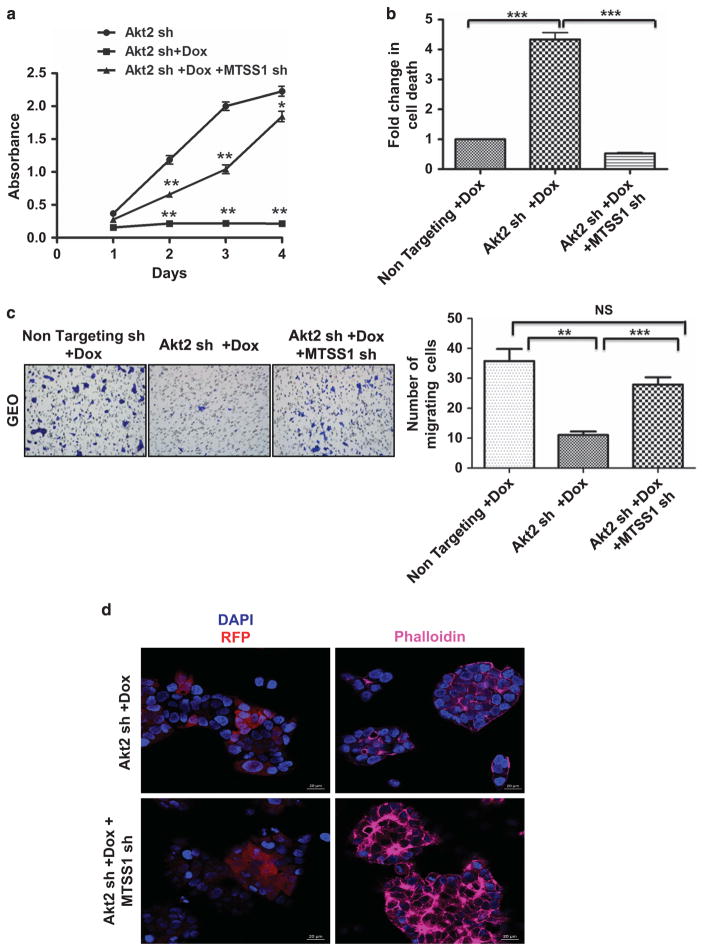
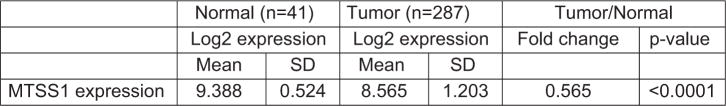
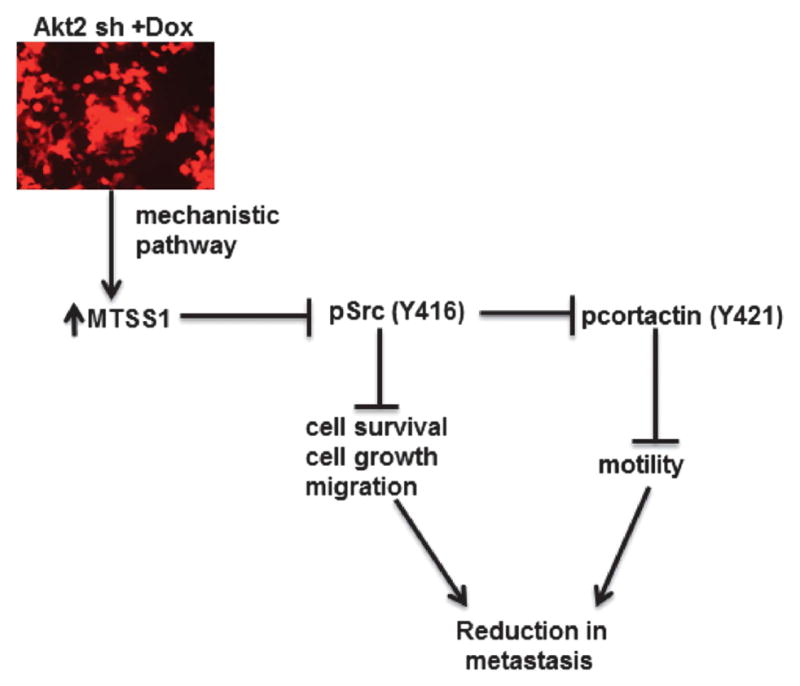
Survival signaling is critical for the metastatic program of cancer cells. The current study investigated the role of Akt survival proteins in colorectal cancer (CRC) metastasis and explored potential mechanisms of Akt-mediated metastasis regulation. Using an orthotopic implantation model in mice, which uniquely recapitulates the entire multistep process of CRC metastasis, combined with an inducible system of short hairpin RNA-mediated Akt isoform knockdown in human CRC cells, our studies confirm a role of Akt2 in CRC cell dissemination to distant organs in vivo. Akt2 deficiency profoundly inhibited the development of liver lesions in mice, whereas Akt1 had no effect under the experimental conditions used in the study. Array analysis of human metastatic genes identified the scaffolding protein metastasis suppressor 1 (MTSS1) as a novel Akt2-regulated gene. Inducible loss of Akt2 in CRC cells robustly upregulated MTSS1 at the messenger RNA and protein level, and the accumulated protein was functionally active as shown by its ability to engage an MTSS1-Src-cortactin inhibitory axis. MTSS1 expression led to a marked reduction in levels of functional cortacin (pcortactin Y421), an actin nucleation-promoting factor that has a crucial role in cancer cell invasion and metastasis. MTSS1 was also shown to mediate suppressive effects of Akt2 deficiency on CRC cell viability, survival, migration and actin polymerization in vitro. The relevance of these findings to human CRC is supported by analysis of The Cancer Genome Atlas (TCGA) and NCBI GEO data sets, which demonstrated inverse changes in expression of Akt2 and MTSS1 during CRC progression. Taken together, the data identify MTSS1 as a new Akt2-regulated gene, and point to suppression of MTSS1 as a key step in the metastasis-promoting effects of Akt2 in CRC cells.


Conflict of interest statement

CONFLICT OF INTEREST

The authors declare no conflict of interest.

Figures

Figure 1
Figure 1
Establishment of colon cancer cells with inducible knockdown of Akt1 or Akt2. (a) Western blot analysis of endogenous levels of Akt1, Akt2 and Akt3 in GEO and CBS colon cancer cells. (b) Immunoblot analysis confirms that the expression of Akt1, Akt2 and Akt3 does not change in GEO and CBS cells expressing non-targeting shRNA (sh) on treatment with Dox (left panels). Knockdown of Akt1 (middle panel) and Akt2 (right panel) is achieved in GEO and CBS cells expressing Akt isoform-specific shRNA on addition of Dox. No change in the expression of other Akt isoforms is observed, confirming specificity of knockdown. GAPDH was used as a loading control. Data are representative of at least three independent experiments.
Figure 2
Figure 2
Dox-induced loss of Akt2 reduces metastasis of orthotopically implanted GFP-labeled GEO cells in vivo. (a) Bar graph showing no significant change in primary tumor weight on Dox-induced loss of Akt1 (left panel) and a modest reduction on loss of Akt2 (right panel). n =22, n =19 and n =17 for non-targeting, Akt1 and Akt2 sh mouse groups, respectively. (b) Fluorescent images of mice, primary tumor and liver following orthotopic implantation of GFP-labeled GEO cells expressing non-targeting, Akt1 or Akt2 shRNA. Arrows indicate metastatic deposits in the liver. The table below the images shows quantification of mice bearing primary tumors and liver metastases. (c) qPCR analysis shows similar expression of human GAPDH in livers from mice implanted with GEO cells expressing Akt1 shRNA and non-targeting shRNA (left panel), whereas a marked reduction in GAPDH expression is seen on Dox-induced suppression of Akt2 (right panel). (d) Quantification of liver metastatic spots shows no significant difference on loss of Akt1 (left panel) and a significant reduction on loss of Akt2 (right panel). n =13, n =10 and n =6 for non-targeting, Akt1 and Akt2 sh mouse groups, respectively. (NS =not significant, *P<0.05, ***P<0.001).
Figure 3
Figure 3
Regulation of the expression of metastasis-related genes by Akt isoforms. GEO cells expressing non-targeting shRNA (sh) or Akt1, Akt2 or Akt3 shRNA were treated with Dox for 5 days and cDNA samples were subjected to real-time PCR using the Human Tumor Metastasis RT2 Profiler PCR array from Super Array Biosciences (Qiagen). Top panel: Venn diagram showing differentially expressed metastatic genes on knockdown of each of the three Akt isoforms. Genes shown in red have higher expression in Akt isoform knockdown cells relative to non-targeting shRNA (sh) expressing cells, whereas genes in green show reduced expression. Lower panel: list of genes that showed differential expression (>two-fold) on loss of individual Akt isoforms. MTSS1 is shown in bold.
Figure 4
Figure 4
MTSS1 is markedly upregulated and functionally active in colon cancer cells following Dox-induced suppression of Akt2 in vitro and in vivo. (a) Western blot analysis of MTSS1, pSrc (Y416), total Src and pCTTN (Y421) in Akt2, Akt1 and Akt3 knockdown GEO (upper panel) and CBS (lower panel) colon cancer cells. Akt2 deficiency, but not Akt1 or Akt3 deficiency, markedly upregulates MTSS1 in association with suppression of pSrc (Y416) and pCTTN (Y421) in both cell lines. Expression of total Src remains unchanged. (b) Left panel: western blot analysis confirming MTSS1 suppression by shRNA in Akt2 knockdown GEO cells. Right panel: the decrease in pSrc (Y416) and pCTTN (Y421) induced by loss of Akt2 is prevented by shRNA-induced depletion of MTSS1. (c) Immunohistochemical (upper panels) and western blot (lower panel) analysis of primary tumor samples show that suppression of Akt2 in GEO cells in vivo is also associated with increased expression of MTSS1. Bar graphs show the results of quantification of immunohistochemical staining using Definiens Tissue Studies 64 (Dual 4.1) software. (d) Suppression of Akt1 in GEO cells in vivo fails to affect MTSS1 expression. (NS =not significant, ***P<0.001). Scale bar is 5 μm. Western blot data in c are representative of at least three independent experiments.
Figure 4
Figure 4
MTSS1 is markedly upregulated and functionally active in colon cancer cells following Dox-induced suppression of Akt2 in vitro and in vivo. (a) Western blot analysis of MTSS1, pSrc (Y416), total Src and pCTTN (Y421) in Akt2, Akt1 and Akt3 knockdown GEO (upper panel) and CBS (lower panel) colon cancer cells. Akt2 deficiency, but not Akt1 or Akt3 deficiency, markedly upregulates MTSS1 in association with suppression of pSrc (Y416) and pCTTN (Y421) in both cell lines. Expression of total Src remains unchanged. (b) Left panel: western blot analysis confirming MTSS1 suppression by shRNA in Akt2 knockdown GEO cells. Right panel: the decrease in pSrc (Y416) and pCTTN (Y421) induced by loss of Akt2 is prevented by shRNA-induced depletion of MTSS1. (c) Immunohistochemical (upper panels) and western blot (lower panel) analysis of primary tumor samples show that suppression of Akt2 in GEO cells in vivo is also associated with increased expression of MTSS1. Bar graphs show the results of quantification of immunohistochemical staining using Definiens Tissue Studies 64 (Dual 4.1) software. (d) Suppression of Akt1 in GEO cells in vivo fails to affect MTSS1 expression. (NS =not significant, ***P<0.001). Scale bar is 5 μm. Western blot data in c are representative of at least three independent experiments.
Figure 5
Figure 5
Effects of Akt2 knockdown on colon cancer cell proliferation, survival, viability and motility in vivo and in vitro. Immunohistochemical staining for the proliferation marker Ki67 (a) and TUNEL staining for apoptotic cells (b) in non-targeting shRNA- and Akt2 shRNA-expressing GEO primary tumors after administration of Dox in the drinking water for 3 weeks. Ki67 and TUNEL staining was quantified using Definiens Tissue Studies 64 (Dual 4.1) software and by counting positively stained apoptotic bodies, respectively, and the results are presented in the corresponding bar graphs. Akt2 knockdown was associated with a significant decrease in Ki67 staining intensity and a significant increase in the % of apoptotic cells in primary GEO cell tumors. (c) MTT assays demonstrate a marked reduction in viable GEO and CBS cells on loss of Akt2 by administration of Dox in vitro. (d) DNA fragmentation assays reveal a 5–6-fold increase in cell death on Akt2 knockdown in GEO and CBS cells in vitro. (e) Representative images of crystal violet-stained GEO cells that have passed through the membrane in a transwell migration assay showing a reduction in cell motility in the absence of Akt2 at 36 h. (**P<0.01 and ***P<0.001). Scale bar is 5 μm. Data are representative of at least three independent experiments.
Figure 5
Figure 5
Effects of Akt2 knockdown on colon cancer cell proliferation, survival, viability and motility in vivo and in vitro. Immunohistochemical staining for the proliferation marker Ki67 (a) and TUNEL staining for apoptotic cells (b) in non-targeting shRNA- and Akt2 shRNA-expressing GEO primary tumors after administration of Dox in the drinking water for 3 weeks. Ki67 and TUNEL staining was quantified using Definiens Tissue Studies 64 (Dual 4.1) software and by counting positively stained apoptotic bodies, respectively, and the results are presented in the corresponding bar graphs. Akt2 knockdown was associated with a significant decrease in Ki67 staining intensity and a significant increase in the % of apoptotic cells in primary GEO cell tumors. (c) MTT assays demonstrate a marked reduction in viable GEO and CBS cells on loss of Akt2 by administration of Dox in vitro. (d) DNA fragmentation assays reveal a 5–6-fold increase in cell death on Akt2 knockdown in GEO and CBS cells in vitro. (e) Representative images of crystal violet-stained GEO cells that have passed through the membrane in a transwell migration assay showing a reduction in cell motility in the absence of Akt2 at 36 h. (**P<0.01 and ***P<0.001). Scale bar is 5 μm. Data are representative of at least three independent experiments.
Figure 6
Figure 6
Effects of Akt2 knockdown on colon cancer cell viability, survival and motility are mediated by MTSS1. (a) MTT assay showing a marked decrease in GEO cell viability on Dox-induced loss of Akt2, which is rescued by MTSS1 deficiency in Akt2 knockdown cells. (b) DNA fragmentation assays reveal a significant protection from Akt2 depletion-induced cell death by knockdown of MTSS1. (c) Representative images of transwell migration assays (36 h) showing a reduction in migration of GEO cells on loss of Akt2, which is prevented by MTSS1 deficiency. The bar graph shows quantification of the data from migration assays. (d) Representative images of GEO cells stained with the F-actin probe Alexa Fluor 633 phalloidin (far red). The DNA dye DAPI (blue) was used to detect cell nuclei and RFP staining (Red) reflects treatment with Dox. Scale bar is 20 μm (NS =not significant, **P<0.01 and ***P<0.001). Data are representative of at least three independent experiments.
Figure 7
Figure 7
Expression of MTSS1 in human CRC samples. Differential expression of MTSS1 in normal human colonic mucosa and CRC samples from The Cancer Genome Atlas database.
Figure 8
Figure 8
Proposed mechanism for the inhibitory effects of Akt2 deficiency on the metastatic program of colon cancer cells. Loss of Akt2 upregulates MTSS1, leading to inhibition of Src-mediated phosphorylation/activation of CTTN and reduced cell motility. Inhibition of Src also leads to a reduction in CRC growth and survival, as previously described by others., Together, these effects impair the metastatic capacity of CRC in vivo.

Similar articles

Cited by

References

    1. Jemal A, Murray T, Ward E, Samuels A, Tiwari RC, Ghafoor A, et al. Cancer statistics, 2005. CA Cancer J Clin. 2005;55:10–30. - PubMed
    1. Jin K, Gao W, Lu Y, Lan H, Teng L, Cao F. Mechanisms regulating colorectal cancer cell metastasis into liver (Review) Oncol Lett. 2012;3:11–15. - PMC - PubMed
    1. National Cancer Institute. SEER Stat Fact Sheets: Colon and Rectum Cancer. Surveillance, Epidemiology and End Results Program [online] 2010
    1. Weigelt B, Peterse JL, van 't Veer LJ. Breast cancer metastasis: markers and models. Nat Rev Cancer. 2005;5:591–602. - PubMed
    1. Kienast Y, von Baumgarten L, Fuhrmann M, Klinkert WE, Goldbrunner R, Herms J, et al. Real-time imaging reveals the single steps of brain metastasis formation. Nat Med. 2009;16:116–122. - PubMed

Publication types