. 2017 Jan 9;12(1):e0169110.
doi: 10.1371/journal.pone.0169110. eCollection 2017.

Facial Emotion Recognition and Expression in Parkinson's Disease: An Emotional Mirror Mechanism?

Affiliations

Facial Emotion Recognition and Expression in Parkinson's Disease: An Emotional Mirror Mechanism?

Lucia Ricciardi et al. PLoS One. .

Abstract

Background and aim: Parkinson's disease (PD) patients have impairment of facial expressivity (hypomimia) and difficulties in interpreting the emotional facial expressions produced by others, especially for aversive emotions. We aimed to evaluate the ability to produce facial emotional expressions and to recognize facial emotional expressions produced by others in a group of PD patients and a group of healthy participants in order to explore the relationship between these two abilities and any differences between the two groups of participants.

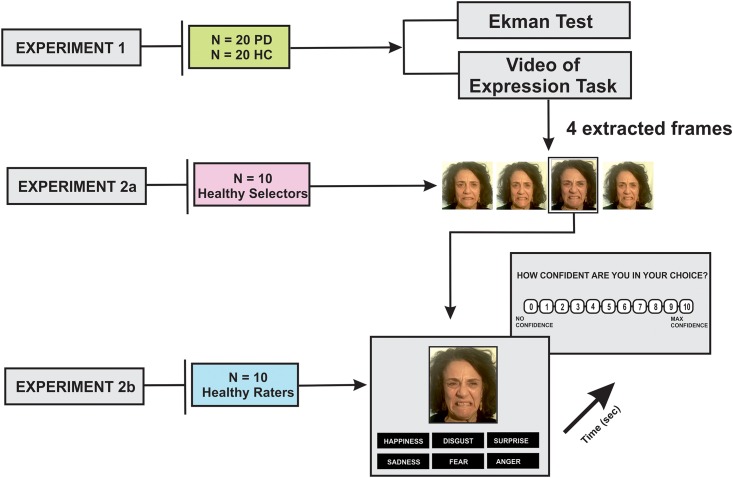
Methods: Twenty non-demented, non-depressed PD patients and twenty healthy participants (HC) matched for demographic characteristics were studied. The ability of recognizing emotional facial expressions was assessed with the Ekman 60-faces test (Emotion recognition task). Participants were video-recorded while posing facial expressions of 6 primary emotions (happiness, sadness, surprise, disgust, fear and anger). The most expressive pictures for each emotion were derived from the videos. Ten healthy raters were asked to look at the pictures displayed on a computer-screen in pseudo-random fashion and to identify the emotional label in a six-forced-choice response format (Emotion expressivity task). Reaction time (RT) and accuracy of responses were recorded. At the end of each trial the participant was asked to rate his/her confidence in his/her perceived accuracy of response.

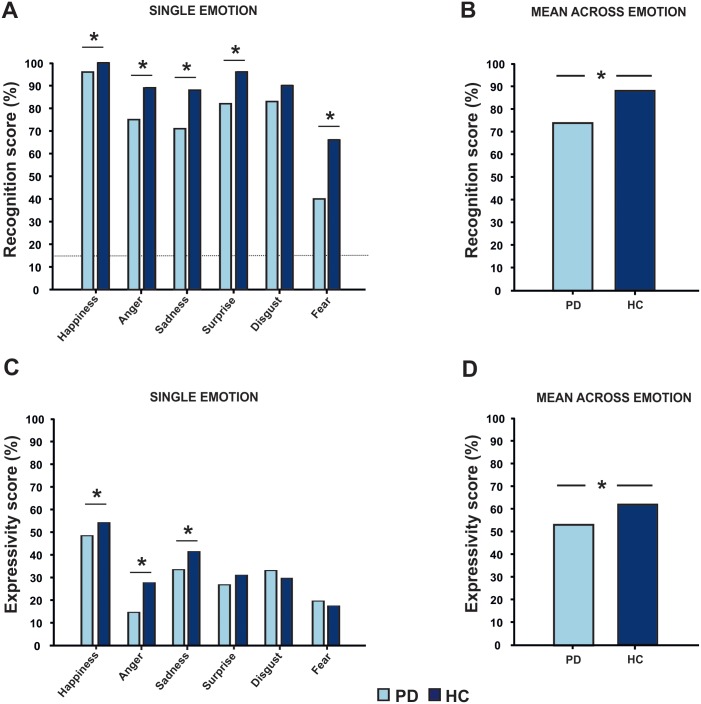
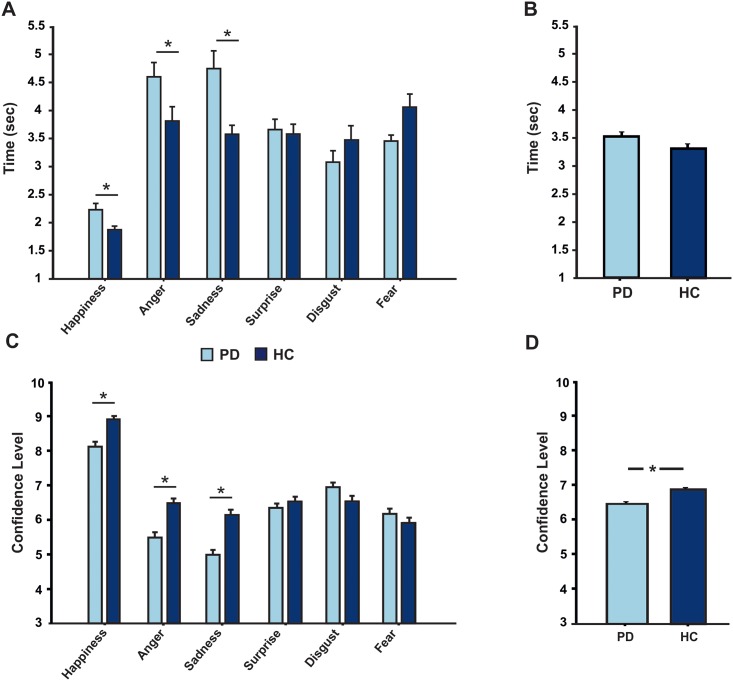
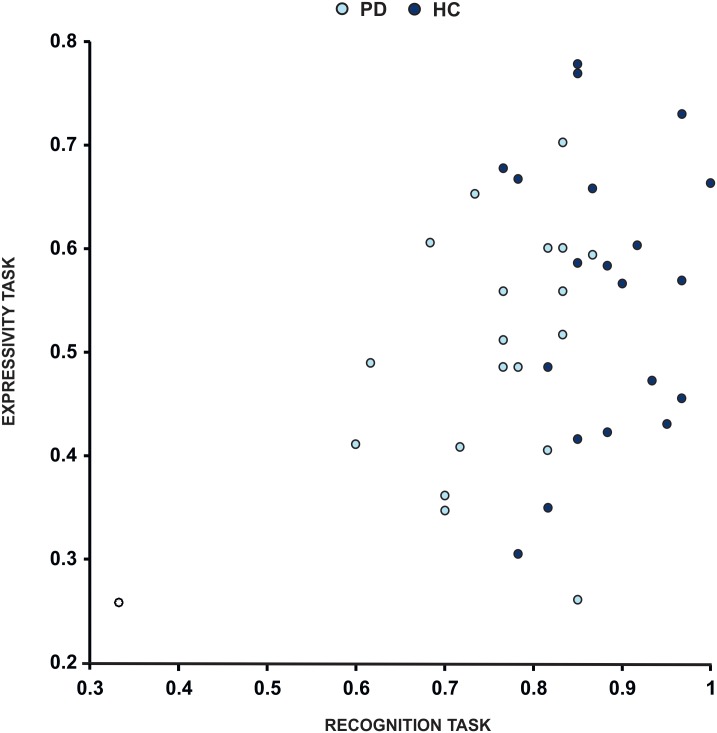
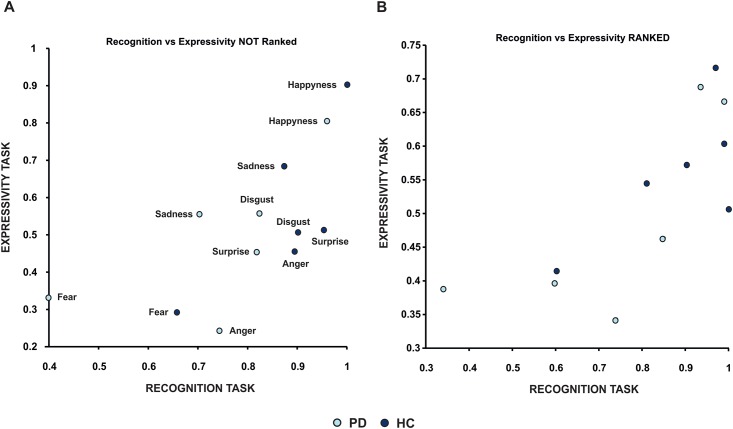
Results: For emotion recognition, PD reported lower score than HC for Ekman total score (p<0.001), and for single emotions sub-scores happiness, fear, anger, sadness (p<0.01) and surprise (p = 0.02). In the facial emotion expressivity task, PD and HC significantly differed in the total score (p = 0.05) and in the sub-scores for happiness, sadness, anger (all p<0.001). RT and the level of confidence showed significant differences between PD and HC for the same emotions. There was a significant positive correlation between the emotion facial recognition and expressivity in both groups; the correlation was even stronger when ranking emotions from the best recognized to the worst (R = 0.75, p = 0.004).

Conclusions: PD patients showed difficulties in recognizing emotional facial expressions produced by others and in posing facial emotional expressions compared to healthy subjects. The linear correlation between recognition and expression in both experimental groups suggests that the two mechanisms share a common system, which could be deteriorated in patients with PD. These results open new clinical and rehabilitation perspectives.


Conflict of interest statement

The authors have declared that no competing interests exist.

Figures

Fig 1
Fig 1. Experimental design displaying the main 3 experiments.
In experiment 1, Parkinson’s disease (PD) and Healthy Controls (HC) subjects performed an emotion recognition task and a facial expressivity task (which was videotaped). In experiment 2a, ten healthy subjects selected the most expressing frames extracted from the videos for each emotion and for each subject. In experiment 2b, ten healthy raters (different from those employed in experiment 2a) judged PD and HC expressivity. At the end of each trial, the participant was asked to rate his/her level of confidence in their choice clicking the mouse on a visual analogic scale on the screen, where “max confidence” was 10 “no confidence at all” was 0. Reaction time (RT; in sec) and accuracy of responses were recorded.
Fig 2
Fig 2
Panel A and B: Facial emotion recognition task (Ekman 60 Faces test) scores for each single emotion (A) and total score for all emotions taken together (B) for HC (dark blue) and PD group (light blue). Higher scores indicate better performance. PD patients performed worse than HC in all emotions but disgust. Dash line represents the cut-off above which participant performs better than chance (see text for details). Panel C and D: Facial expressivity task scores for HC and PD. Higher scores indicate better performance. PD patients were judged less expressive than HC for all emotions but disgust, fear and surprise. For both tasks we plotted the percentage of corrected answer (%) to facilitate the understanding of the results. Asterisks represent a statistical difference between experimental groups (p<0.05)
Fig 3
Fig 3
A) Reaction Time in choosing the pictures of PD (light blue) and HC (dark blue) in the expressivity task. Raters were faster in judging HC than PD pictures expressing happiness, anger and sadness. B) Level of confidence in evaluating which emotional expression was displayed in the pictures of PD (light blue) and HC (dark blue) in the expressivity task. Raters were more confident of their choices when evaluating HC’ pictures compared to PD’ s pictures for happiness, anger and sadness.
Fig 4
Fig 4. Correlation between raters’ Reaction Time (RT) in choosing the pictures and their level of confidence during their own choices (CL) for both the PD (panel A) and HC (panel B) frames during the expressivity task.
A positive correlation between RT (y axis) and CL (x axis) is shown.
Fig 5
Fig 5. Correlation between facial recognition task scores and expressivity task scores.
Each dot represents the mean value across emotions per subject in HC group (light blue) and PD group (dark blue). There is a significant positive correlation between facial recognition (x axis) and expressivity (y axis) for all subjects.
Fig 6
Fig 6. Correlations between facial emotion recognition and expression per single emotion.
Each dot represents the mean value across subjects per each emotion for both HC (light blue) and PD (dark blue). There is a significant positive correlation between recognition (x axis) and expression (y axis) in both groups (panel A, each emotion is displayed next to the corresponding dot). The correlation is even stronger when ranking emotions from the best recognized to the worst (Panel B, see text for details).

References

    1. Carr L, Iacoboni M, Dubeau MC, Mazziotta JC, Lenzi GL. Neural mechanisms of empathy in humans: a relay from neural systems for imitation to limbic areas. Proc Natl Acad Sci U S A. 2003. April 29; 100(9):5497–502. 10.1073/pnas.0935845100 - DOI - PMC - PubMed
    1. Fusar-Poli P, Placentino A, Carletti F, Landi P, Allen P, Surguladze S, et al. Functional atlas of emotional faces processing: a voxel-based meta-analysis of 105 functional magnetic resonance imaging studies. J Psychiatry Neurosci. 2009. November;34(6):418–32. Review - PMC - PubMed
    1. Phan KL, Wager T, Taylor SF, Liberzon I. Functional neuroanatomy of emotion: a meta-analysis of emotion activation studies in PET and fMRI. Neuroimage. 2002. June;16(2):331–48. - PubMed
    1. Phillips ML, Young AW, Senior C, Brammer M, Andrew C, Calder AJ, et al. A specific neural substrate for perceiving facial expressions of disgust. Nature. 1997. October 2;389(6650):495–8. 10.1038/39051 - DOI - PubMed
    1. Buck R, Duffy RJ. Nonverbal communication of affect in brain-damaged patients. Cortex. 1980. October;16(3):351–62. - PubMed