

Significant Association of Urinary Toxic Metals and Autism-Related Symptoms-A Nonlinear Statistical Analysis with Cross Validation
- PMID: 28068407
- PMCID: PMC5222512
- DOI: 10.1371/journal.pone.0169526
Significant Association of Urinary Toxic Metals and Autism-Related Symptoms-A Nonlinear Statistical Analysis with Cross Validation
Abstract
Introduction: A number of previous studies examined a possible association of toxic metals and autism, and over half of those studies suggest that toxic metal levels are different in individuals with Autism Spectrum Disorders (ASD). Additionally, several studies found that those levels correlate with the severity of ASD.
Methods: In order to further investigate these points, this paper performs the most detailed statistical analysis to date of a data set in this field. First morning urine samples were collected from 67 children and adults with ASD and 50 neurotypical controls of similar age and gender. The samples were analyzed to determine the levels of 10 urinary toxic metals (UTM). Autism-related symptoms were assessed with eleven behavioral measures. Statistical analysis was used to distinguish participants on the ASD spectrum and neurotypical participants based upon the UTM data alone. The analysis also included examining the association of autism severity with toxic metal excretion data using linear and nonlinear analysis. "Leave-one-out" cross-validation was used to ensure statistical independence of results.
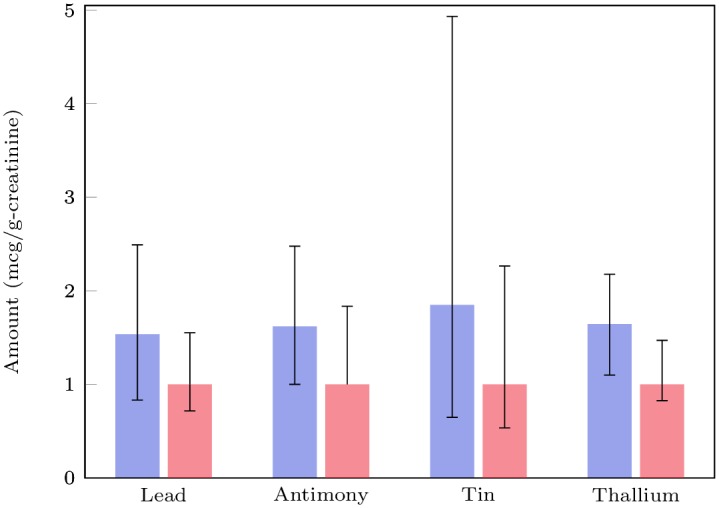
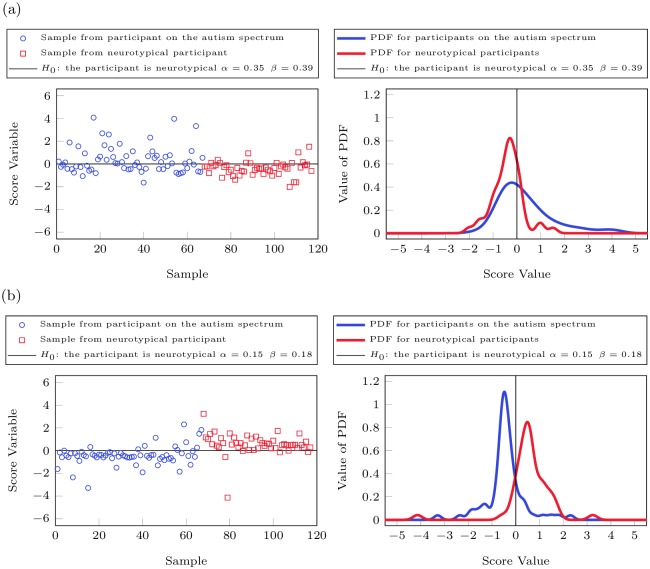
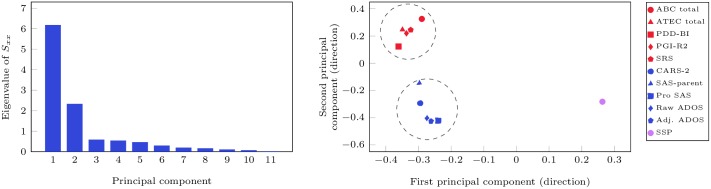
Results and discussion: Average excretion levels of several toxic metals (lead, tin, thallium, antimony) were significantly higher in the ASD group. However, ASD classification using univariate statistics proved difficult due to large variability, but nonlinear multivariate statistical analysis significantly improved ASD classification with Type I/II errors of 15% and 18%, respectively. These results clearly indicate that the urinary toxic metal excretion profiles of participants in the ASD group were significantly different from those of the neurotypical participants. Similarly, nonlinear methods determined a significantly stronger association between the behavioral measures and toxic metal excretion. The association was strongest for the Aberrant Behavior Checklist (including subscales on Irritability, Stereotypy, Hyperactivity, and Inappropriate Speech), but significant associations were found for UTM with all eleven autism-related assessments with cross-validation R2 values ranging from 0.12-0.48.
Conflict of interest statement
DQ is an employee of Doctor’s Data, a company that provides clinical testing including testing of urinary toxic metals. RH is an employee of Arizona Allergy Associates, which provides allergy-related medical treatments. This does not alter our adherence to PLOS ONE policies on sharing data and materials. The other authors have declared that no competing interests exist.
Figures
References
-
- DeSoto MC, Hitlan RT. Fish Consumption Advisories and the Surprising Relationship to Prevalence Rate of Developmental Disability as Reported by Public Schools. Journal of Environmental Protection. 2012;03(11):1579–1589. 10.4236/jep.2012.311174 - DOI
MeSH terms
Substances
Grants and funding
LinkOut - more resources
Full Text Sources
Other Literature Sources
Medical
