Vector flow mapping analysis of left ventricular energetic performance in healthy adult volunteers
- PMID: 28068909
- PMCID: PMC5223342
- DOI: 10.1186/s12872-016-0444-7
Vector flow mapping analysis of left ventricular energetic performance in healthy adult volunteers
Erratum in
-
Erratum to: Vector flow mapping analysis of left ventricular energetic performance in healthy adult volunteers.BMC Cardiovasc Disord. 2017 Jun 30;17(1):172. doi: 10.1186/s12872-017-0612-4. BMC Cardiovasc Disord. 2017. PMID: 28666420 Free PMC article. No abstract available.
Abstract
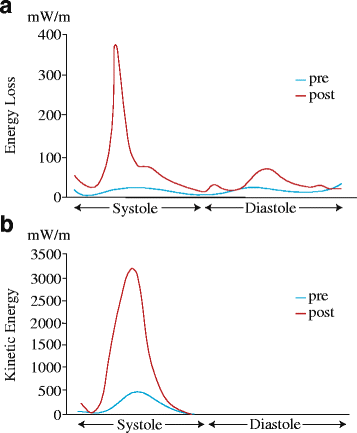
Background: Vector flow mapping, a novel flow visualization echocardiographic technology, is increasing in popularity. Energy loss reference values for children have been established using vector flow mapping, but those for adults have not yet been provided. We aimed to establish reference values in healthy adults for energy loss, kinetic energy in the left ventricular outflow tract, and the energetic performance index (defined as the ratio of kinetic energy to energy loss over one cardiac cycle).
Methods: Transthoracic echocardiography was performed in fifty healthy volunteers, and the stored images were analyzed to calculate energy loss, kinetic energy, and energetic performance index and obtain ranges of reference values for these.
Results: Mean energy loss over one cardiac cycle ranged from 10.1 to 59.1 mW/m (mean ± SD, 27.53 ± 13.46 mW/m), with a reference range of 10.32 ~ 58.63 mW/m. Mean systolic energy loss ranged from 8.5 to 80.1 (23.52 ± 14.53) mW/m, with a reference range of 8.86 ~ 77.30 mW/m. Mean diastolic energy loss ranged from 7.9 to 86 (30.41 ± 16.93) mW/m, with a reference range of 8.31 ~ 80.36 mW/m. Mean kinetic energy in the left ventricular outflow tract over one cardiac cycle ranged from 200 to 851.6 (449.74 ± 177.51) mW/m with a reference range of 203.16 ~ 833.15 mW/m. The energetic performance index ranged from 5.3 to 37.6 (18.48 ± 7.74), with a reference range of 5.80 ~ 36.67.
Conclusions: Energy loss, kinetic energy, and energetic performance index reference values were defined using vector flow mapping. These reference values enable the assessment of various cardiac conditions in any clinical situation.
Keywords: Energetic performance index; Energy loss; Kinetic energy; Vector flow mapping; Vortex.
Figures
References
-
- Rodriguez Munoz D, Moya Mur JL, Fernandez-Golfin C, Becker Filho DC, Gonzalez Gomez A, Fernandez Santos S, et al. Left ventricular vortices as observed by vector flow mapping: main determinants and their relation to left ventricular filling. Echocardiogr. 2015;32:96–105. doi: 10.1111/echo.12584. - DOI - PubMed
-
- Sengupta PP, Khandheria BK, Korinek J, Jahangir A, Yoshifuku S, Milosevic I, et al. Left ventricular isovolumic flow sequence during sinus and paced rhythms: new insights from use of high-resolution Doppler and ultrasonic digital particle imaging velocimetry. J Am Coll Cardiol. 2007;49:899–908. doi: 10.1016/j.jacc.2006.07.075. - DOI - PubMed
-
- Hong GR, Pedrizzetti G, Tonti G, Li P, Wei Z, Kim JK, et al. Characterization and quantification of vortex flow in the human left ventricle by contrast echocardiography using vector particle image velocimetry. JACC Cardiovasc Imaging. 2008;1:705–17. doi: 10.1016/j.jcmg.2008.06.008. - DOI - PMC - PubMed
MeSH terms
LinkOut - more resources
Full Text Sources
Other Literature Sources

