

Analytes related to erythrocyte metabolism are reliable biomarkers for preanalytical error due to delayed plasma processing in metabolomics studies
- PMID: 28069401
- PMCID: PMC5321821
- DOI: 10.1016/j.cca.2017.01.005
Analytes related to erythrocyte metabolism are reliable biomarkers for preanalytical error due to delayed plasma processing in metabolomics studies
Abstract
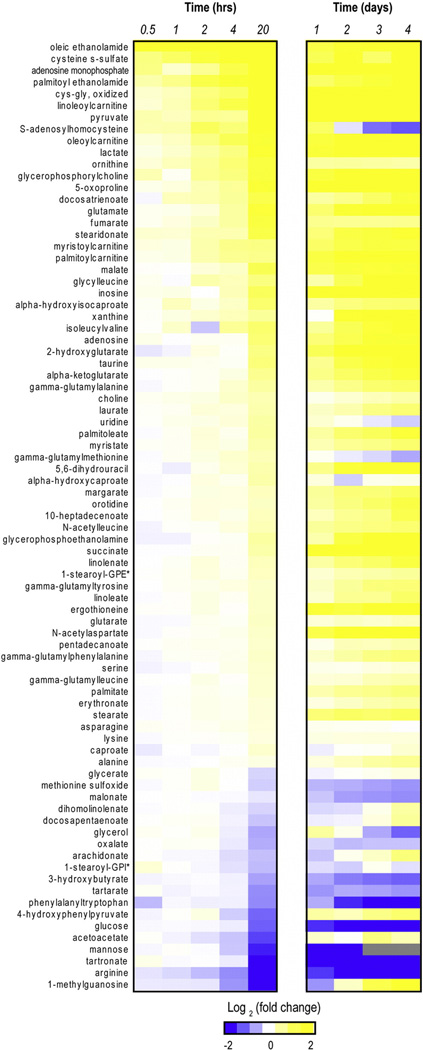
Background: Delaying plasma separation after phlebotomy (processing delay) can cause perturbations of numerous small molecule analytes. This poses a major challenge to the clinical application of metabolomics analyses. In this study, we further define the analyte changes that occur during processing delays and generate a model for the post hoc detection of this preanalytical error.
Methods: Using an untargeted metabolomics platform we analyzed EDTA-preserved plasma specimens harvested after processing delays lasting from minutes to days. Identified biomarkers were tested on (i) a test-set of samples exposed to either minimal (n=28) or long delays (n=40) and (ii) samples collected in a clinical setting for metabolomics analysis (n=141).
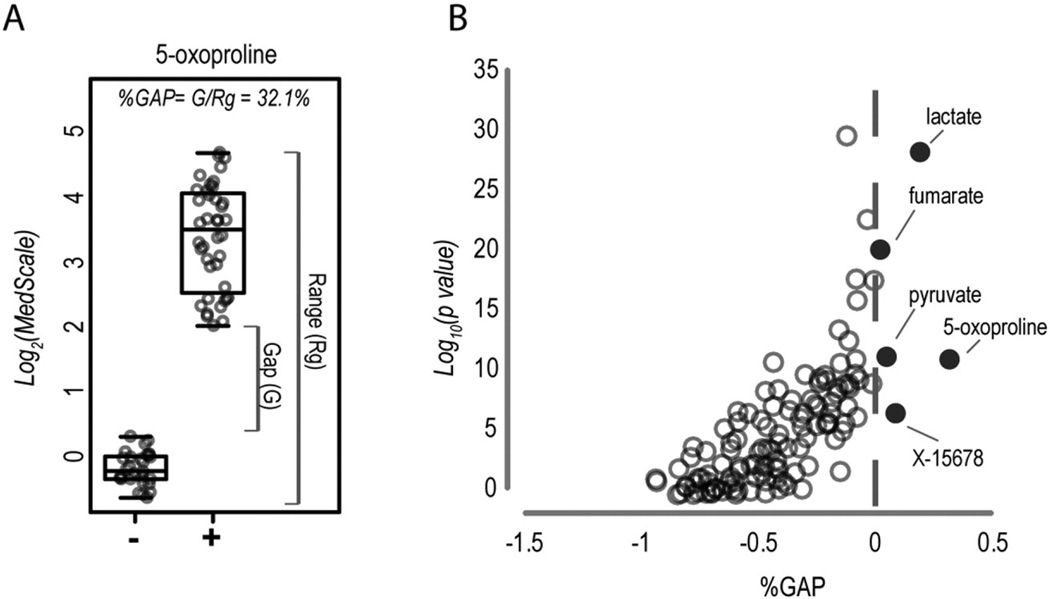
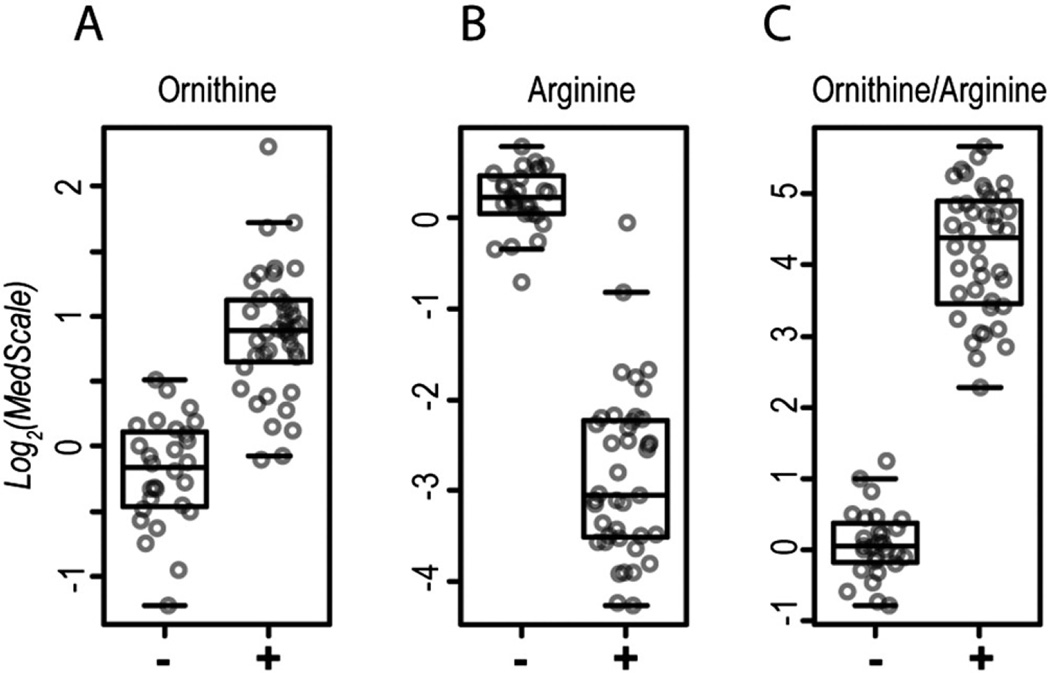
Results: A total of 149 of 803 plasma analytes changed significantly during processing delays lasting 0-20h. Biomarkers related to erythrocyte metabolism, e.g., 5-oxoproline, lactate, and an ornithine/arginine ratio, were the strongest predictors of plasma separation delays, providing 100% diagnostic accuracy in the test set. Together these biomarkers could accurately predict processing delays >2h in a pilot study and we found evidence of sample mishandling in 4 of 141 clinically derived specimens.
Conclusions: Our study highlights the widespread effects of processing delays and proposes that erythrocyte metabolism creates a reproducible signal that can identify mishandled specimens in metabolomics studies.
Keywords: Clinical metabolomics; Phlebotomy; Preanalytical error; Quality control; Whole blood stability.
Copyright © 2017 Elsevier B.V. All rights reserved.
Conflict of interest statement
Mahim Jain, Sarah H. Elsea and Marcus J. Miller are members of the Department of Molecular and Human Genetics at Baylor College of Medicine, and this department, alone or as part of a joint venture with Miraca Holdings, offers a number of clinical tests on a fee-for-service basis, but these in no way conflict with the research reported here. Adam D. Kennedy is an employee of Metabolon, Inc. and, as such, has affiliations with or financial involvement with Metabolon, Inc. The authors have no other relevant affiliations or financial involvement with any organization or entity with a financial interest in or financial conflict with the subject matter or materials discussed in the manuscript apart from those disclosed.
Figures
Similar articles
-
Global biochemical analysis of plasma, serum and whole blood collected using various anticoagulant additives.PLoS One. 2021 Apr 8;16(4):e0249797. doi: 10.1371/journal.pone.0249797. eCollection 2021. PLoS One. 2021. PMID: 33831088 Free PMC article.
-
Quality markers addressing preanalytical variations of blood and plasma processing identified by broad and targeted metabolite profiling.Clin Chem. 2014 Feb;60(2):399-412. doi: 10.1373/clinchem.2013.211979. Epub 2013 Dec 4. Clin Chem. 2014. PMID: 24305685
-
Metabolomic Quality Assessment of EDTA Plasma and Serum Samples.Biopreserv Biobank. 2016 Oct;14(5):416-423. doi: 10.1089/bio.2015.0092. Epub 2016 Jun 27. Biopreserv Biobank. 2016. PMID: 27348730
-
Preanalytical aspects on short- and long-term storage of serum and plasma.Diagnosis (Berl). 2019 Mar 26;6(1):51-56. doi: 10.1515/dx-2018-0037. Diagnosis (Berl). 2019. PMID: 30138113 Review.
-
A review of blood sample handling and pre-processing for metabolomics studies.Electrophoresis. 2017 Sep;38(18):2232-2241. doi: 10.1002/elps.201700086. Epub 2017 Jun 8. Electrophoresis. 2017. PMID: 28543881 Review.
Cited by
-
Global biochemical analysis of plasma, serum and whole blood collected using various anticoagulant additives.PLoS One. 2021 Apr 8;16(4):e0249797. doi: 10.1371/journal.pone.0249797. eCollection 2021. PLoS One. 2021. PMID: 33831088 Free PMC article.
-
A Case Study of Dysfunctional Nicotinamide Metabolism in a 20-Year-Old Male.Metabolites. 2023 Mar 8;13(3):399. doi: 10.3390/metabo13030399. Metabolites. 2023. PMID: 36984839 Free PMC article.
-
Reproducibility of non-fasting plasma metabolomics measurements across processing delays.Metabolomics. 2018 Sep 25;14(10):129. doi: 10.1007/s11306-018-1429-6. Metabolomics. 2018. PMID: 30830406
-
Metabolomics to Improve the Diagnostic Efficiency of Inborn Errors of Metabolism.Int J Mol Sci. 2020 Feb 11;21(4):1195. doi: 10.3390/ijms21041195. Int J Mol Sci. 2020. PMID: 32054038 Free PMC article. Review.
-
Biomarker Reproducibility Challenge: A Review of Non-Nucleotide Biomarker Discovery Protocols from Body Fluids in Breast Cancer Diagnosis.Cancers (Basel). 2023 May 16;15(10):2780. doi: 10.3390/cancers15102780. Cancers (Basel). 2023. PMID: 37345117 Free PMC article. Review.
References
-
- Plebani M, Sciacovelli L, Aita A, Padoan A, Chiozza ML. Quality indicators to detect pre-analytical errors in laboratory testing. Clin. Chim. Acta. 2014;432:44–48. - PubMed
-
- Kellogg MD, Ellervik C, Morrow D, Hsing A, Stein E, Sethi AA. Preanalytical considerations in the design of clinical trials and epidemiological studies. Clin. Chem. 2015;61(6):797–803. - PubMed
MeSH terms
Substances
Grants and funding
LinkOut - more resources
Full Text Sources
Other Literature Sources
