Diverging temperature responses of CO2 assimilation and plant development explain the overall effect of temperature on biomass accumulation in wheat leaves and grains
- PMID: 28069595
- PMCID: PMC5391697
- DOI: 10.1093/aobpla/plw092
Diverging temperature responses of CO2 assimilation and plant development explain the overall effect of temperature on biomass accumulation in wheat leaves and grains
Abstract
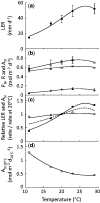
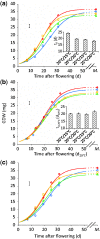
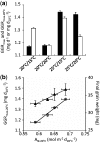
There is a growing consensus in the literature that rising temperatures influence the rate of biomass accumulation by shortening the development of plant organs and the whole plant and by altering rates of respiration and photosynthesis. A model describing the net effects of these processes on biomass would be useful, but would need to reconcile reported differences in the effects of night and day temperature on plant productivity. In this study, the working hypothesis was that the temperature responses of CO2 assimilation and plant development rates were divergent, and that their net effects could explain observed differences in biomass accumulation. In wheat (Triticum aestivum) plants, we followed the temperature responses of photosynthesis, respiration and leaf elongation, and confirmed that their responses diverged. We measured the amount of carbon assimilated per "unit of plant development" in each scenario and compared it to the biomass that accumulated in growing leaves and grains. Our results suggested that, up to a temperature optimum, the rate of any developmental process increased with temperature more rapidly than that of CO2 assimilation and that this discrepancy, summarised by the CO2 assimilation rate per unit of plant development, could explain the observed reductions in biomass accumulation in plant organs under high temperatures. The model described the effects of night and day temperature equally well, and offers a simple framework for describing the effects of temperature on plant growth.
Keywords: Biomass; development; grain growth; photosynthesis; respiration; specific leaf area; temperature; thermal time; wheat..
Published by Oxford University Press on behalf of the Annals of Botany Company.
Figures


Similar articles
-
A rapid and systematic review of the clinical effectiveness and cost-effectiveness of paclitaxel, docetaxel, gemcitabine and vinorelbine in non-small-cell lung cancer.Health Technol Assess. 2001;5(32):1-195. doi: 10.3310/hta5320. Health Technol Assess. 2001. PMID: 12065068
-
Antidepressants for pain management in adults with chronic pain: a network meta-analysis.Health Technol Assess. 2024 Oct;28(62):1-155. doi: 10.3310/MKRT2948. Health Technol Assess. 2024. PMID: 39367772 Free PMC article.
-
Effects of atmospheric CO2 concentration on transpiration and leaf elongation responses to drought in Triticum aestivum, Lolium perenne and Festuca arundinacea.Ann Bot. 2024 Nov 13;134(5):787-802. doi: 10.1093/aob/mcae114. Ann Bot. 2024. PMID: 39086357 Free PMC article.
-
Comparison of self-administered survey questionnaire responses collected using mobile apps versus other methods.Cochrane Database Syst Rev. 2015 Jul 27;2015(7):MR000042. doi: 10.1002/14651858.MR000042.pub2. Cochrane Database Syst Rev. 2015. PMID: 26212714 Free PMC article.
-
Sertindole for schizophrenia.Cochrane Database Syst Rev. 2005 Jul 20;2005(3):CD001715. doi: 10.1002/14651858.CD001715.pub2. Cochrane Database Syst Rev. 2005. PMID: 16034864 Free PMC article.
References
-
- Alkhatib K, Paulsen GM. 1984. Mode of high-temperature injury to wheat during grain development. Physiologia Plantarum 61:363–368.
-
- Atkin OK, Scheurwater I, Pons TL. 2006. High thermal acclimation potential of both photosynthesis and respiration in two lowland Plantago species in contrast to an alpine congeneric. Global Change Biology 12:500–515.
-
- Atkin OK, Scheurwater I, Pons TL. 2007. Respiration as a percentage of daily photosynthesis in whole plants is homeostatic at moderate, but not high, growth temperatures. New Phytologist 174:367–380. - PubMed
-
- Atkin OK, Tjoelker MG. 2003. Thermal acclimation and the dynamic response of plant respiration to temperature. Trends in Plant Science 8:343–351. - PubMed
-
- Borras-Gelonch G, Slafer GA, Casas AM, van Eeuwijk F, Romagosa I. 2010. Genetic control of pre-heading phases and other traits related to development in a double-haploid barley (Hordeum vulgare L.) population. Field Crops Research 119:36–47.
LinkOut - more resources
Full Text Sources
Other Literature Sources

