

DNA sequence properties that predict susceptibility to epiallelic switching
- PMID: 28069706
- PMCID: PMC5331756
- DOI: 10.15252/embj.201695602
DNA sequence properties that predict susceptibility to epiallelic switching
Abstract
Transgenerationally heritable epialleles are defined by the stable propagation of alternative transcriptional states through mitotic and meiotic cell cycles. Given that the propagation of DNA methylation at CpG sites, mediated in Arabidopsis by MET1, plays a central role in epigenetic inheritance, we examined genomewide DNA methylation in partial and complete loss-of-function met1 mutants. We interpreted the data in relation to transgenerational epiallelic stability, which allowed us to classify chromosomal targets of epigenetic regulation into (i) single copy and methylated exclusively at CpGs, readily forming epialleles, and (ii) transposon-derived, methylated at all cytosines, which may or may not form epialleles. We provide evidence that DNA sequence features such as density of CpGs and genomic repetitiveness of the loci predispose their susceptibility to epiallelic switching. The importance and predictive power of these genetic features were confirmed by analyses of common epialleles in natural Arabidopsis accessions, epigenetic recombinant inbred lines (epiRILs) and also verified in rice.
Keywords: DNA methylation; epialleles; epigenetic; transcriptional silencing.
© 2017 The Authors. Published under the terms of the CC BY NC ND 4.0 license.
Figures

Venn diagrams of genomewide hypomethylated CpG DMRs (chromosomes 1–4) of met1‐3 compared with control Col‐0 plants and later compared with DMRs of met1‐1 and MET1 +. For met1 and MET1 + plants, DMRs were considered with a relative difference to wild type of ≥ 80 and ≥ 40%, respectively. Overlapping areas represent number of cytosines in shared portions of DMRs.
Venn diagram of genomewide hypomethylated CpG DMRs (chromosomes 1–4) of met1‐1 (≥ 80% difference) and combined (union of DMRs) MET1 + plant pools (≥ 40% difference). Permutation test with 1,000 iterations using regioneR package (Gel et al, 2016) confirmed a statistically significant overlap (P‐value = 0.001).
Scatter plot of CpG DMRs (chromosomes 1–4) of met1‐1 and union of DMRs MET1 + plants (DMR criteria as in A and B). Linear regression—red line. The correlation coefficient is indicated in the bottom right corner of the plot.
Hierarchical clustering of CpG methylation in genomic tiles of wild‐type (WT), met1‐1, met1‐3 and MET1 + plants (chromosomes 1–4). The methylation of MET1 + was adjusted by subtracting 50% of the methylation derived from wild type. Clustering based on randomly selected genomic tiles (10%) (n = 13,668) representing ≥ 50% CpG‐methylated in wild type were used for analyses.
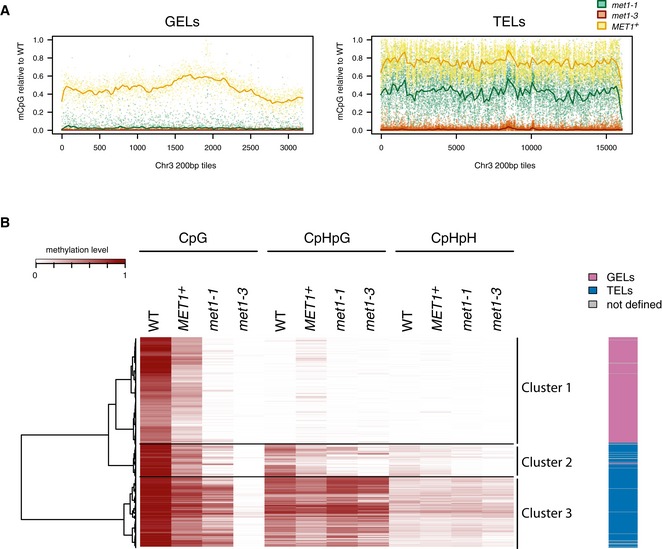
Distribution of CpG‐methylation levels at 200‐bp tiles (≥ 80% CpG‐methylated in wild type) along chromosome 3 at GELs or TELs (Appendix Table S2). Lines were generated using lowest smooth R with a span of 1/50. Legend to colours assigned to particular genotypes is above the right graph. MET1 + showed is mean value of two replicates. Corresponding graphs for chromosomes 2 and 4 are in Appendix Fig S5.
Heatmap R of DNA methylation levels at 200‐bp tiles (10% randomly selected on chromosome 1, CpG‐methylated in wild type ≥ 40%, n = 11,094). Sequence context of methylation, genotypes and methylation levels are indicated above the figure. Tiles were ordered according to hierarchical clustering (hclust, R software environment) and the main clusters are delineated by horizontal lines and explained at the right of the figure and in the main text. The Euclidean distance dendrogram is presented left of the figure. MET1 + sample is derived from the second replicate. Column on the right illustrates distribution of GELs and TELs as they are defined in Appendix Table S2 and Appendix Fig S3.

Box plot of CpG methylation levels in met1‐1 relative to wild type (WT) in 200‐bp tiles assigned to TELs (Appendix Table S2) and sorted according to the number of CpGs. The genomewide tile distribution is illustrated by a grey box plot at the top of the chart.
Box plot of CpG methylation levels in met1‐1 relative to wild type (WT) in tandem repeats sorted according to the size of the repeat units (left) or their copy number (right).
Density plot of CpG methylation level distribution in met1‐1 relative to wild type for 200‐bp tiles assigned to cluster 2 and cluster 3 as defined in Fig 1B. Vertical dashed lines mark criteria for E‐TEL and R‐TEL selection which incorporate mostly tiles from cluster 2 and cluster 3, respectively.
Distribution of averaged DNA methylation levels in wild‐type, met1‐1, met1‐3 and MET1 + plants at R‐TELs and E‐TELs. Identities of R‐TEL and E‐TEL are according to TAIR10 annotation (as defined in Appendix Fig S8) and aligned at the 5′ end or the 3′ ends (vertical lines). Average methylation levels for 50‐bp sliding windows of 200 bp are plotted. R‐TELs and E‐TELs at chromosome 5 were excluded from the analyses. Black dashed line displays theoretical mid‐parental methylation level between WT and met1‐3.
Box plot of H3K9me2 relative enrichment calculated for R‐TELs and E‐TELs (200‐bp tiles) in wild type (WT) and met1‐3 using processed data from Deleris et al (2012). The original normalized log2 signal from ChIP analysis was averaged per 200‐bp tile.
Box plot of small RNA levels at R‐TELs and E‐TELs in wild type and met1‐3. Genomic distribution of small RNA form Lister et al (2008) was related to 200‐bp tiles assigned to R‐TELs and E‐TELs and expressed as hits per tile.

- A, B
Genome browser snapshots of DNA methylation profiles for wild type, met1‐1 and met1‐3 of two E‐TELs (Atlantys2 transposons) neighbouring R‐TEL (Copia and Athila transposons). Different tracks are used for different cytosine contexts (CpG, CpHpG and CpHpH). Graph obtained using IGV (Robinson et al, 2011).

Distribution of averaged CpG methylation levels in wild‐type, met1‐1, met1‐3 and MET1 + plants at intact elements in ATLANTYS2 (> 4 kb, n = 34), ATGP1 (> 4 kb, n = 40) and ATENSPM5 (> 8 kb, n = 9) families, aligned at the 5′ end or the 3′ ends (vertical lines). Average methylation levels for 50‐bp sliding windows of 200 bp are plotted. Black dashed line displays theoretical mid‐parental methylation level between WT and met1‐3. The approximate TE structure is reported at the bottom part of each graph.
Distribution of blast hit counts per 200‐bp window obtained from a representative member of the ATLANTYS2 (AT3TE61290), ATGP1 (AT4TE08245) and ATENSPM5 (AT1TE42890) families, respectively; 200‐bp DNA tiles were blasted against the unmasked Arabidopsis TAIR10 genome reference with the blastn default parameters, with no limits to the reported hits and a max expect threshold of 10. The average value of the area indicated with a red line is reported. TE structure and CpG density (CpGs per 100 bp) are reported for each family at the bottom of the graphs.

DNA methylation analyses at two GELs (ATG4G00450 and AT4G11970) and two E‐TELs (AT1G47660 and AT4G25530 FWA promoter) of parental strains (met1‐3 mutant, which is in the Col‐0 accession and Landsberg erecta (Ler) accession (panels marked P) and F1 hybrid (panels marked F1) containing met1‐3‐ and Ler‐derived chromosomes, which can be distinguished by DNA polymorphism. Open circles represent unmethylated cytosine and closed circles methylated.
DNA methylation analyses at two R‐TELs (AT3TE46565‐Copia28 and AT2G17690‐SDC promoter). General marking as in (A).
Transcript levels in met1‐1 and in reciprocal F1 hybrids of met1‐1 and wild type (colour code above the graphs) of transposons assigned to R‐TEL or E‐TEL. The values are log ratio relative to the wild type adjusted to 0 (baseline).
Transcript levels in met1‐1 and in reciprocal F1 hybrids of met1‐1 and wild type of genes assigned to R‐TEL or E‐TEL.
Transcript levels in met1‐1 and in two independent transgenic lines with a reintroduced copy of the MET1 gene (T‐MET1a and T‐MET1b). Colour code is given next the graphs. The identities of the tested loci are provided below the graph. General marking as in (C).
Distribution of averaged CpG methylation levels in wild type (WT), met1‐1 and complemented met1‐1 lines (T‐MET1a and T‐MET1b) at R‐TELs and E‐TELs applied to TAIR10 annotation and aligned at the 5′ end or the 3′ ends (vertical lines). Average methylation levels for each 200‐bp window are plotted. Chromosome 5 was excluded from the analyses. Corresponding plot for GELs is displayed on Fig EV4.

Schematic representation of the transgenic cassette used to transform met1 mutant with wild‐type MET1 gene. A black line indicates the approximate position of the MET1 antibody recognition site.
Western blot analysis of MET1 protein levels with the anti‐MET1 antibody. Wild type (WT), met1‐1, met1‐3 and met2,3,4 triple mutants were tested to examine the specificity of antibodies. In two independent transgenic lines (T‐MET1a and T‐MET1b), MET1 protein accumulates to levels comparable to the wild type. Loading control with prominent Rubisco signal stained with Ponceau S.

Distribution of averaged CpG methylation levels in wild type (WT), met1‐1 and complemented met1‐1 lines (T‐MET1a and T‐MET1b) at GELs applied to TAIR10 annotation and aligned at the 5′ (TSS) end or the 3′ ends (TTS) (vertical lines). Average methylation levels for 50‐bp sliding windows of 200 bp are plotted. Chromosome 5 was excluded from the analyses. Similar plots for TELs are reported in Fig 4F.
Box plots showing CpG remethylation observed for GELs, E‐TELs and R‐TELs in complemented met1‐1 lines (T‐MET1a and T‐MET1b). The CpG methylation is relative to the difference between met1‐1 mutant (set as 0) and wild type (set as 1). Boxes delimit the the first and third quartiles, and whiskers the lowest and the highest value within 1.5 IQR of the lower and the upper quartile, respectively. The horizontal lines represent the data medians.
Distribution of averaged CpG methylation levels in wild type (WT), met1‐1 and complemented met1‐1 lines (T‐MET1a and T‐MET1b) at TE families reported in Fig EV2.

Box plot of CpG methylation levels in 200‐bp genomic tiles sorted as R‐TELs, E‐TELs and GELs in wild type, inbred met1‐3 heterozygous mutant (met1‐3 +/−) and wild‐type plants segregated from inbred met1‐3 heterozygous mutant (met1‐3 +/+) (Stroud et al, 2013). Only GEL tiles with on average CpG methylation ≥ 80% were considered for this analysis. Boxes delimit the the first and third quartiles, and whiskers the lowest and the highest value within 1.5 IQR of the lower and the upper quartile, respectively.
Relative distribution of CpG DMRs (among sequences with ≥ 60% CpG methylation in wild type), found in met1‐3 second generation, in long‐time inbreeding (Becker et al, 2011) and among Arabidopsis accessions (Schmitz et al, 2013), partitioned to R‐TELs or GELs/E‐TELs. Total number of considered DMRs (n) for each experimental system is given above the graphs.
Scatter density plots of 200‐bp genomic tiles mappability and CpG methylation relative to wild type (WT) in F1 (backcross of met1‐3 with wild type). The degree of red indicates the dot density. Methylated tiles (more than 80% methylation in CpG context in wild type) with less than five CpGs (N = 36,381) or with more than 12 CpGs (N = 29,980) are separately plotted. The CpG methylation level was obtained by average of all individual CpG positions on the tile sequence with minimal coverage of three reads. Black dashed lines display theoretical mid‐parental methylation level between WT and met1‐3. The solid black lines represent the polynomial regression (R‐loess).
Scatter density plots of 200‐bp genomic tiles mappability and CpG methylation relative to wild type (WT) in epi01 (eighth generation after MET1 re‐introduction). General description is as in (C). Methylated tiles in portion of genome inherited from met1‐3 parent with < 5 CpGs (N = 23,883) or with more than 12 CpGs (N = 20,226) are separately plotted. The percentage of tiles in the section delimited by the dashed lines is given in each corner. The average of CpG count for tiles in the area delimited by the black squares is given above each square.

Arabidopsis genomic 200‐bp tiles were grouped based on DNA sequence features in predicted epiallelic switches (epi), with mappability > 0.6 and CpG sites > 12; or in epigenetic reversible epiallele (rev), with mappability < 0.2 and CpGs < 5. The box plots represent DNA methylation relative to Col‐0 (WT) in met1‐3 backcrossed to wild type (F1) or in three epiRILs (epi01, epi12 and epi28, respectively). For epiRILs, only the genome inherited from the met1‐3 parent was considered for the analysis. Only tiles methylated in wild type (> 5% average CpG methylation) are shown. The data in each group differ with a P‐value < 10−15 (one‐sided Fisher's exact test).
Box plot of CpG DNA methylation in epiallelic switches (epi) and epigenetic reversible epialleles (rev) relative to wild‐type methylation (WT), predicted as described above for Arabidopsis and rice genome in respective met1 mutants (met1‐1 for Arabidopsis). The data in the two groups differ with a P‐value < 10−15 (one‐sided Fisher's exact test).
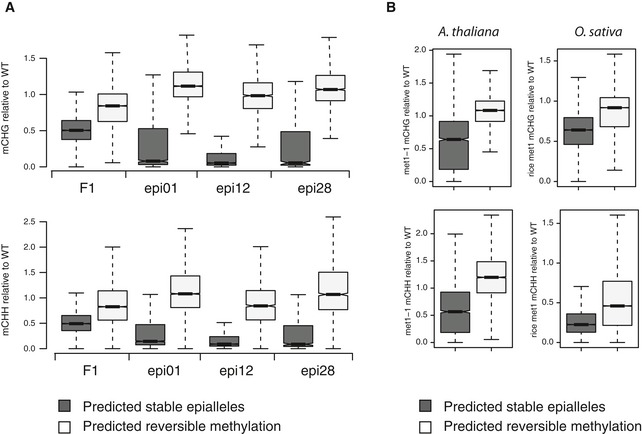
Arabidopsis genomic 200‐bp tiles were grouped based on DNA sequence features in predicted epiallelic switches (epi), with mappability > 0.6 and CpG sites > 12; or in epigenetic reversible epiallele (rev), with mappability < 0.2 and CpGs < 5. The box plots represent DNA methylation relative to Col‐0 (WT) in met1‐3 backcrossed to wild type (F1) or in three epiRILs (epi01, epi12 and epi28, respectively). For epiRILs, only the genome inherited from the met1‐3 parent was considered for the analysis. Tiles with average CpHpG and CpHpH methylation in wild type above 5% are shown in upper and bottom plots, respectively. The data in each group differ with a P‐value < 10−15 (one‐sided Fisher's exact test).
Box plot of non‐CpG DNA methylation in epiallelic switches (epi) and epigenetic reversible epialleles (rev) relative to wild‐type methylation (WT), predicted as described above for Arabidopsis and rice genome in respective met1 mutants (met1‐1 for Arabidopsis). The data in the two groups differ with a P‐value < 10−15 (one‐sided Fisher's exact test).
References
-
- Becker C, Hagmann J, Müller J, Koenig D, Stegle O, Borgwardt K, Weigel D (2011) Spontaneous epigenetic variation in the Arabidopsis thaliana methylome. Nature 480: 245–249 - PubMed
-
- Benjamini Y, Hochberg Y (1995) Controlling the false discovery rate: a practical and powerful approach to multiple testing. J R Stat Soc Ser B Methodol 57: 289–300
Publication types
MeSH terms
Substances
LinkOut - more resources
Full Text Sources
Other Literature Sources
Molecular Biology Databases
