

Ubiquitylation-dependent oligomerization regulates activity of Nedd4 ligases
- PMID: 28069708
- PMCID: PMC5437815
- DOI: 10.15252/embj.201694314
Ubiquitylation-dependent oligomerization regulates activity of Nedd4 ligases
Abstract
Ubiquitylation controls protein function and degradation. Therefore, ubiquitin ligases need to be tightly controlled. We discovered an evolutionarily conserved allosteric restraint mechanism for Nedd4 ligases and demonstrated its function with diverse substrates: the yeast soluble proteins Rpn10 and Rvs167, and the human receptor tyrosine kinase FGFR1 and cardiac IKS potassium channel. We found that a potential trimerization interface is structurally blocked by the HECT domain α1-helix, which further undergoes ubiquitylation on a conserved lysine residue. Genetic, bioinformatics, biochemical and biophysical data show that attraction between this α1-conjugated ubiquitin and the HECT ubiquitin-binding patch pulls the α1-helix out of the interface, thereby promoting trimerization. Strikingly, trimerization renders the ligase inactive. Arginine substitution of the ubiquitylated lysine impairs this inactivation mechanism and results in unrestrained FGFR1 ubiquitylation in cells. Similarly, electrophysiological data and TIRF microscopy show that NEDD4 unrestrained mutant constitutively downregulates the IKS channel, thus confirming the functional importance of E3-ligase autoinhibition.
Keywords: Nedd4; Rsp5; inactivation; oligomerization; ubiquitylation.
© 2017 The Authors.
Figures
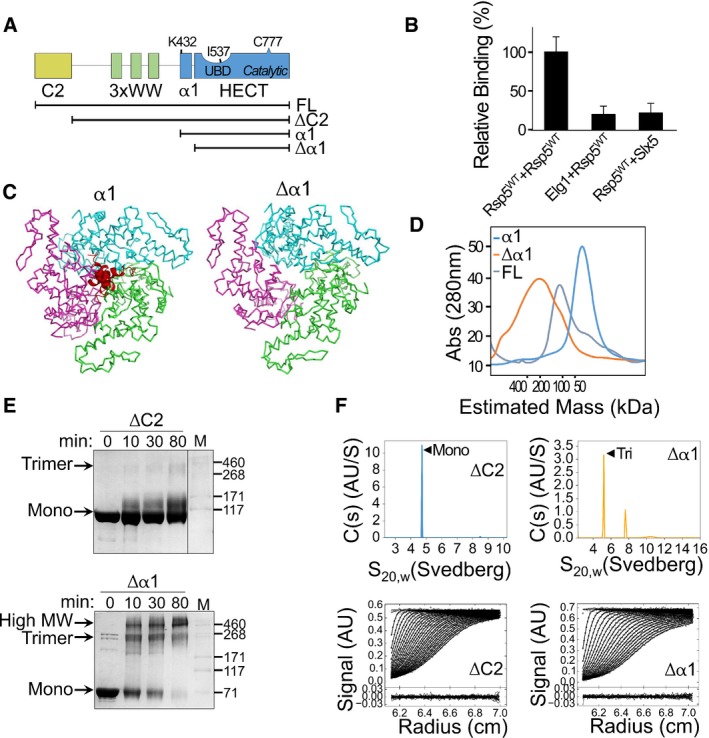
Schematic representation of the Rsp5 domain architecture. Black strips below represent truncated proteins used in this study.
Normalized, mean β‐galactosidase activity in a yeast two‐hybrid assay reporting association of Rsp5 with itself or with the negative controls, ELG1 or SLX5. Mean values and bars of standard deviation from triplicates are shown.
Representation of a trimeric Rsp5 model in the presence (left) or absence (right) of α1 (red). The structure of Rsp5 (3OLM) was superimposed onto the E6AP trimeric structure (1C4Z), with its three HECT protomers depicted in green, pink and cyan. A clash of the α1 helices is apparent at the trimerization interface.
Size‐exclusion chromatography of full‐length Rsp5 or of its HECT domain, with (α1) or without (Δα1) α1. Proteins were loaded on a Superdex 200 16/60 column, and elution was monitored by measuring absorption at 280 nm (A280).
Time‐dependent cross‐linking of ΔC2 or Δα1 Rsp5 with 0.5 mM disuccinimidyl suberate (DSS). Samples were resolved by SDS–PAGE followed by Coomassie blue staining.
Sedimentation velocity data, fits and residuals from analytical ultracentrifugation of ΔC2 or Δα1 Rsp5. Upper panels show continuous distributions analyses c(s) of the sedimenting species for ΔC2 (blue) or Δα1 (orange). Observed/calculated mass (oligomeric order), and distribution of species is presented in Table EV1.
- A
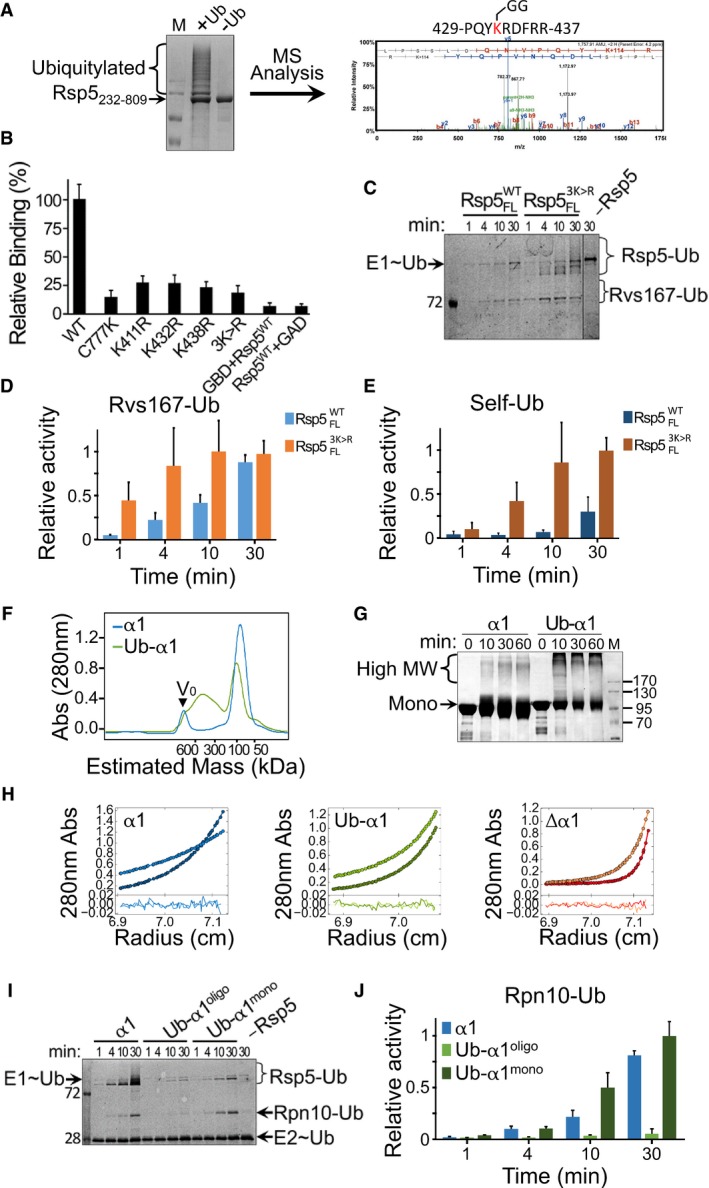
Rsp5232–809 was expressed in bacteria along with ubiquitin, E1 (UBA1) and E2 (Ubc5). The left panel shows Coomassie blue‐stained SDS–PAGE of Rsp5 purified from bacterial lysates. Identification of ubiquitylation sites was performed by mass spectrometry analysis following in‐gel trypsin digestion. A representative tandem mass spectrum of a peptide containing lysine 432 is shown (right panel).
- B
Normalized, mean β‐galactosidase activity reporting self‐association of wild‐type, triple or single K411R/K432R/K438R mutants of Rsp5. Mean values and standard deviation bars from triplicates are shown.
- C–E
(C) Representative gel of time‐dependent in vitro ubiquitylation of MBP‐Rvs167332–482 by Rsp5WT or Rsp53K>R in the presence of fluorescein‐labelled ubiquitin. Imaging of fluorescent ubiquitin conjugates was carried out with a Typhoon laser scanner at 488 nm. Gel quantification of (D) ubiquitylated Rvs167 or (E) self‐ubiquitylated Rsp5. Mean values and standard deviation from three experiment replicates are shown.
- F
SEC of apo HECT (α1) or Ub‐fused HECT (Ub‐α1) proteins tagged with His6‐MBP. The proteins were loaded on a Superdex 200 16/60 column, and elution was monitored by A280 detection.
- G
Time‐dependent cross‐linking of α1 or Ub‐α1 HECT domain in the presence of 0.5 mM DSS. Samples were resolved by SDS–PAGE followed by Coomassie blue staining.
- H
Sedimentation equilibrium (SE) data, fit and residuals of α1, Δα1 or Ub‐α1 HECT domain. A280 data were collected at 8,000 rpm (lighter colours) and at 12,000 rpm (darker colours). The best fit for α1 HECT was obtained with a model of a single ideal solute with the size with a monomer. Alternatively, the best fits for Δα1 and Ub‐α1 HECT were obtained with a model of multiple ideal solutes with the size of monomers, trimers and hexamers (see also Table EV1).
- I
Time‐dependent in vitro ubiquitylation of Rpn10 by apo (α1), oligomeric or monomeric Ub‐fused HECT (Ub‐α1mono and Ub‐α1oligo, respectively), in the presence of fluorescein‐labelled ubiquitin. Reaction set‐up and detection were performed as described in Fig 2C.
- J
Histogram plot showing mean values and standard deviation bars of triplicate measurements.
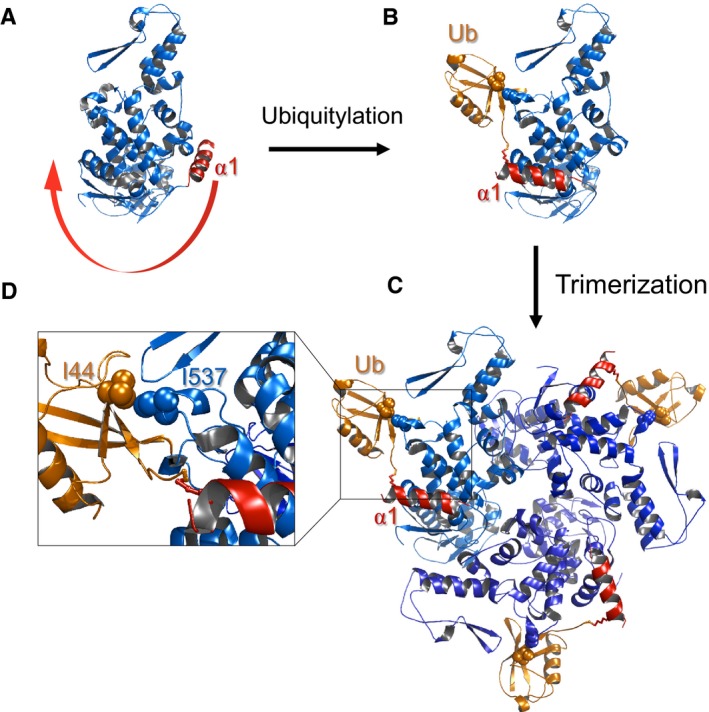
In the apo form, α1 (red) blocks the oligomerization interface.
Upon ubiquitylation, the conjugated ubiquitin binds to the HECT‐UBD, and by thus pulls α1 out of the interface and enables oligomerization.
Model of trimeric Ub‐HECT. Three HECT molecules are depicted in various shades of blue, and ubiquitin moieties are represented in orange.
Enlarged view of the HECT:Ub interface including key residues chosen for experimental assessment of the model.
- A
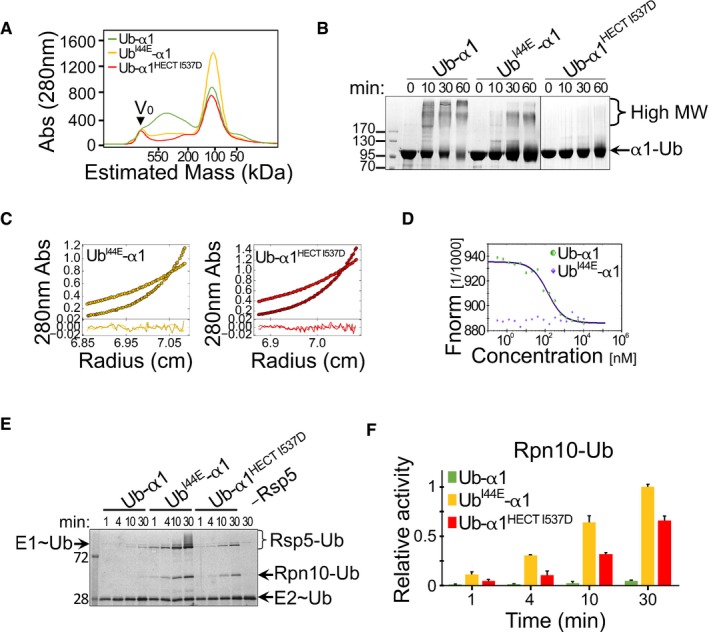
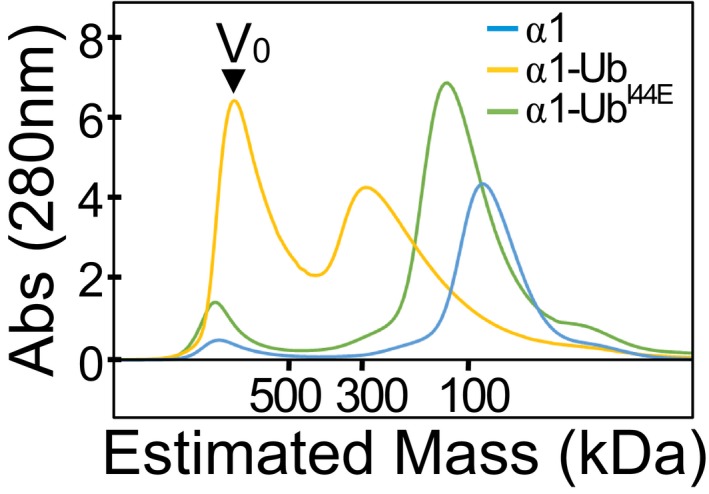
Size‐exclusion chromatography of wild‐type and mutant Ub‐HECT proteins. Ub‐α1, Ub‐α1HECT‐I537D or UbI44E‐α1 HECT proteins were loaded on a Superdex 200 16/60 column, and the elution profile was monitored by A280 detection.
- B
Time‐dependent cross‐linking of Ub‐α1, UbI44E‐α1 or Ub‐α1HECT‐I537D Ub‐HECT proteins in the presence of 0.5 mM DSS. Samples were resolved by SDS–PAGE followed by Coomassie blue staining.
- C
Sedimentation equilibrium (SE) data, fits and residuals of UbI44E‐α1 and Ub‐α1HECT‐I537D mutants. A280 was collected at 8,000 rpm (lighter colours) and at 12,000 rpm (darker colours). The best fits of both mutants were obtained in a model of non‐interacting ideal solutes with mostly monomeric size and < 5% trimers (see also Table EV1).
- D
Microscale thermophoresis (MST) measurements of Ub‐α1 (green) or UbI44E‐α1 (blue). Concentration of red fluorescent NT‐647‐NHS‐labelled Rsp5 was kept constant and titrated with 0.2–1,000 nM of identical unlabelled protein. The y‐axis shows the fluorescence change ratio × 1,000.
- E, F
(E) Representative gel and (F) quantification of in vitro ubiquitylation of Rpn10 by α1, UbI44E‐α1 or Ub‐α1HECT I537D Rsp5, in the presence of fluorescein‐labelled ubiquitin. Mean values and standard deviation bars of three replicates are shown. Reaction set‐up and detection were performed as described in Fig 2C.
- A
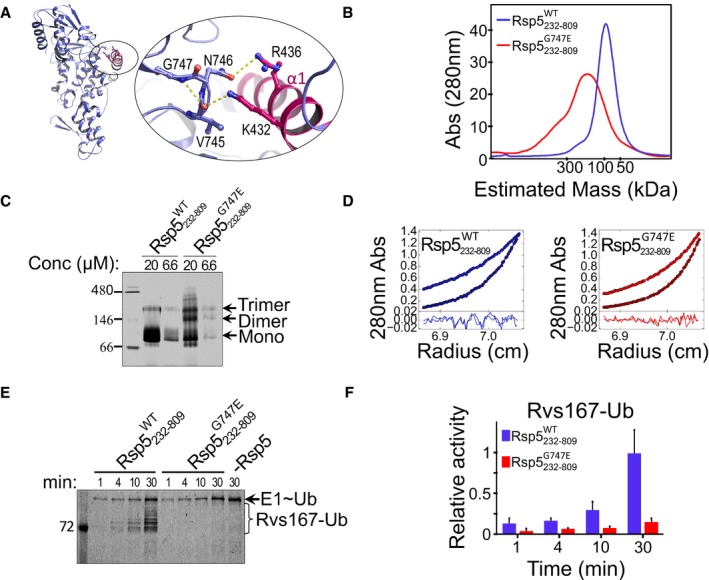
Model showing stabilizing hydrogen bonds within the G747 turn‐like structure, as well as hydrogen bonds between the loop (purple) and the α1 (pink) residues in the Rsp5‐HECT structure (3OLM).
- B
Size‐exclusion chromatography profile of Rsp5232–809 WT or Rsp5232–809 G747E, run on a Superdex 200 16/60 column.
- C
Migration of 6.6 μM and 20 μM of Rsp5232–809 WT or Rsp5232–809 G747E in a native polyacrylamide gel.
- D
AUC‐SE analysis in terms of non‐interacting ideal solutes for Rsp5232‐809 WT or Rsp5232‐809 G747E fused to His6‐MBP at 8,000 and 12,000 rpm (see also Table EV1).
- E, F
(E) Representative gel and (F) quantification (mean and standard deviation from three replicates) of in vitro ubiquitylation of Rvs167 by Rsp5232–809 WT or Rsp5232–809 G747E, in the presence of fluorescein‐labelled ubiquitin. Reaction set‐up and detection were performed as described in Fig 2C.
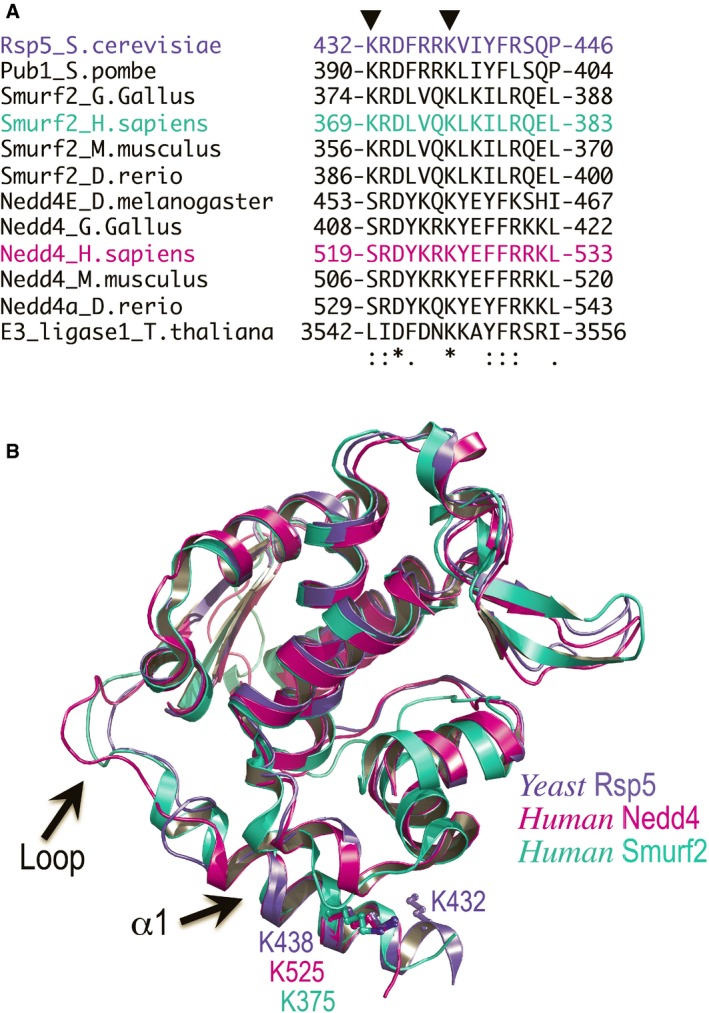
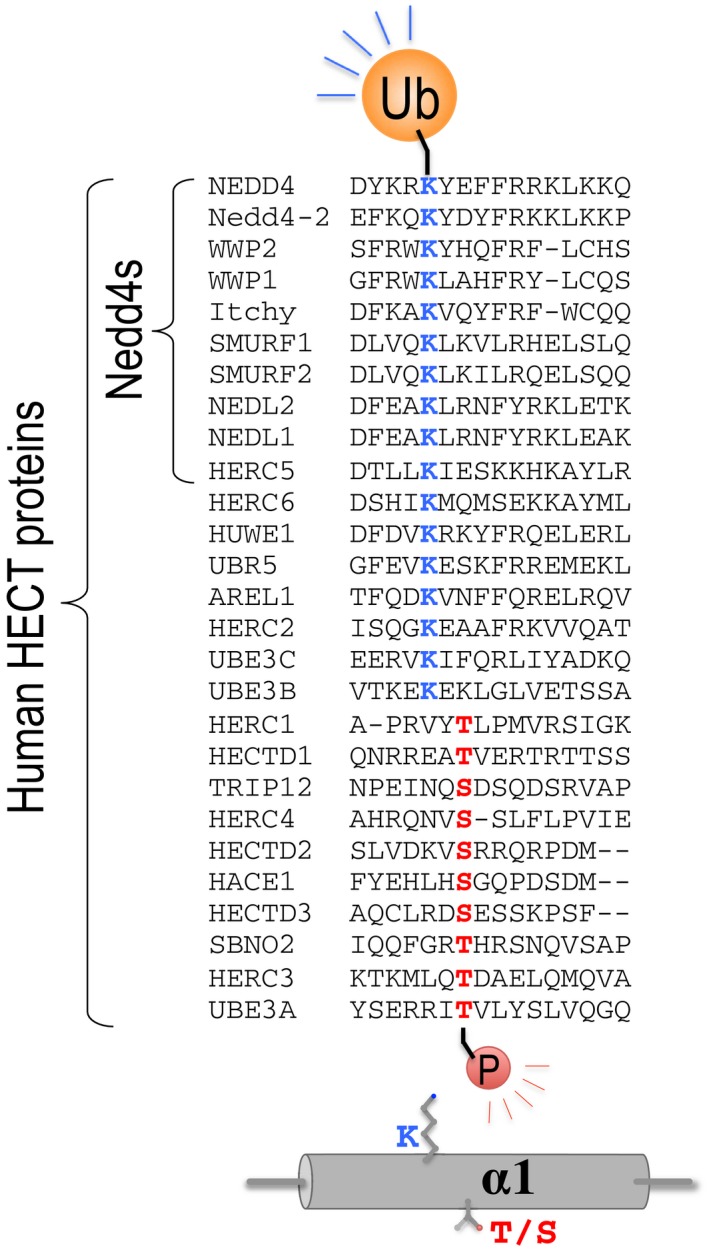
Sequence alignment of α1 showing that K525 of human Nedd4 is fully conserved in the indicated organisms.
The conserved Rsp5 K432 and the Nedd4 K525 are shown as ball and sticks. The loop connecting a1 to the HECT domain is highlighted. The significantly high B‐factor values of the loop atoms and the different conformations assumed in each of the structures indicate that the loop is highly flexible.
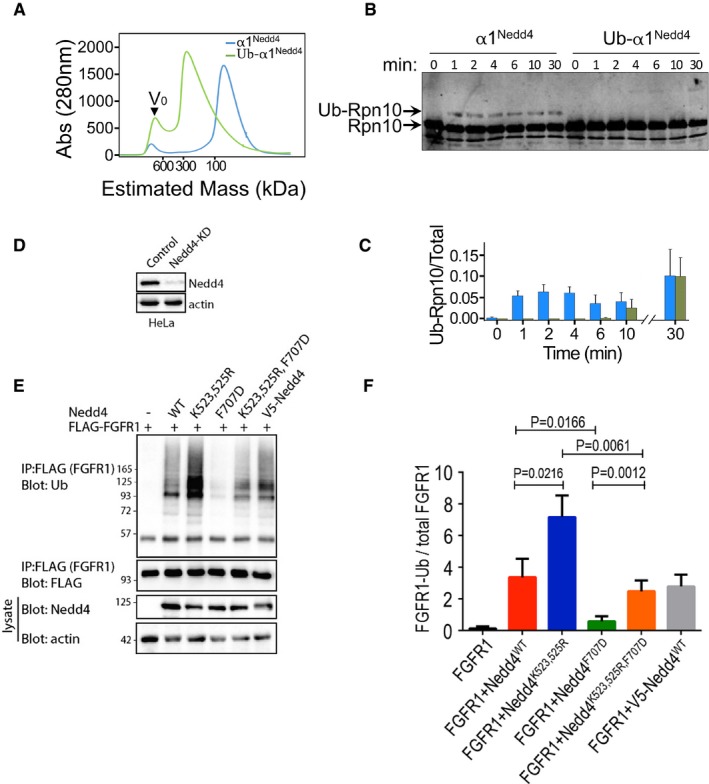
Elution profile from size‐exclusion chromatography of apo HECT (α1Nedd4) or Ub‐fused HECT (α1Nedd4‐Ub) of Nedd4. Proteins were loaded on a Superdex 200 16/60 column, and elution was monitored by A280 measurements.
In vitro ubiquitylation of Rpn10 by apo HECT (α1Nedd4) or Ub‐fused HECT (α1Nedd4‐Ub) of Nedd4. Reaction products were resolved by SDS–PAGE and blotted against a primary rabbit α‐Rpn10 antibody, followed by secondary IR labelled mouse α‐rabbit. Odyssey infrared imaging system was used for IR detection.
Quantified ubiquitylated/total Rpn10 ratio (mean values and standard deviation bars from three replicates).
Documentation of Nedd4 knockdown by shRNA in HeLa cells.
Representative immunoblot of FGFR1 ubiquitylation (in the presence of serum) upon transfection of the indicated wild‐type (WT) and mutant human Nedd4 constructs. V5‐Nedd4 was used as an additional control.
Quantified (mean ± SEM) ubiquitylated/total FGFR1 ratio from three separate experiments. P‐values are from Student's t‐test.
- A
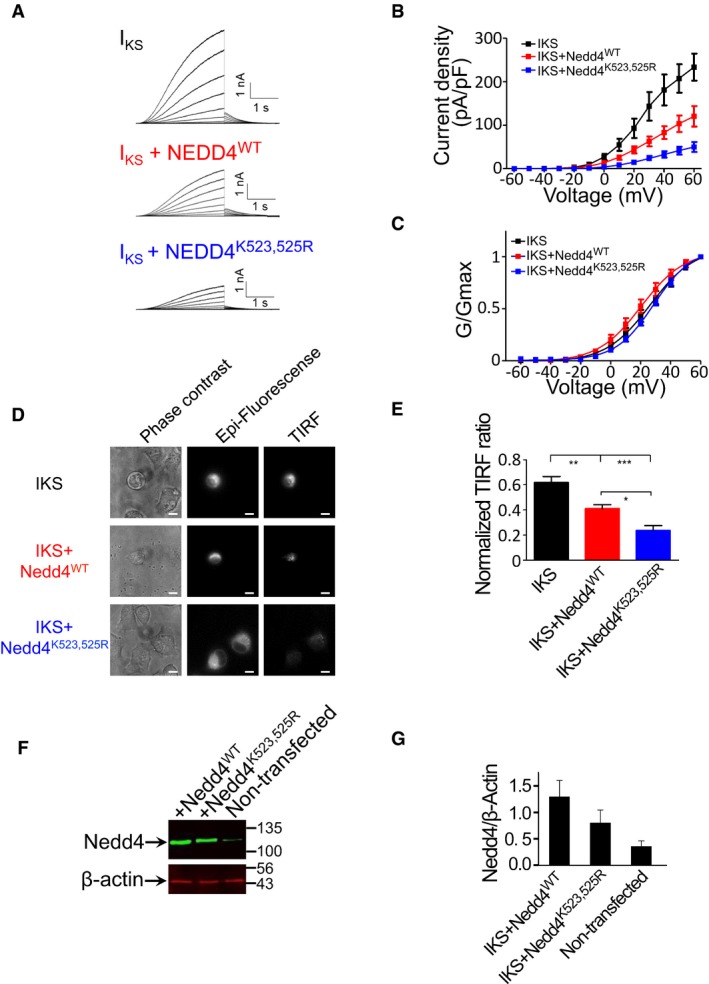
Representative current traces from CHO cells expressing either IKS (KCNQ1 + KCNE1), IKS + Nedd4WT or IKS + Nedd4K523,525R. Cells were held at −90 mV. Membrane voltage was stepped for 3 s from −60 mV to +60 mV in 10 mV increments followed by repolarization to −60 mV for 1.5 s.
- B, C
(B) Current‐voltage (mean ± SEM) and (C) conductance‐voltage (mean ± SEM) relationships of the recorded cells (n = 10–11). Normalized conductance curves were fitted to a single Boltzmann function.
- D
Phase contrast (left panels), epi‐fluorescence (central panels) and TIRF fluorescence (right panels) images of CHO cells expressing either IKS, IKS + Nedd4WT or IKS + Nedd4K523,525R. Scale bars: 10 μm.
- E
Quantification (mean ± SEM) of the TIRF signals was normalized by the TIRF/epi‐fluorescence intensity ratio, using Fiji NIH viewer. n = 10–17; one‐way ANOVA and Bonferroni's multiple comparison test; *P < 0.05, **P < 0.01, ***P < 0.001.
- F
Representative immunoblot with anti‐Nedd4 of total CHO cell lysates from non‐transfected cells and cells transfected with wild‐type or mutant Nedd4. Lysates were also blotted with antibodies against endogenous β‐actin.
- G
Quantified (mean ± SEM) Nedd4/β‐actin ratio (n = 3).
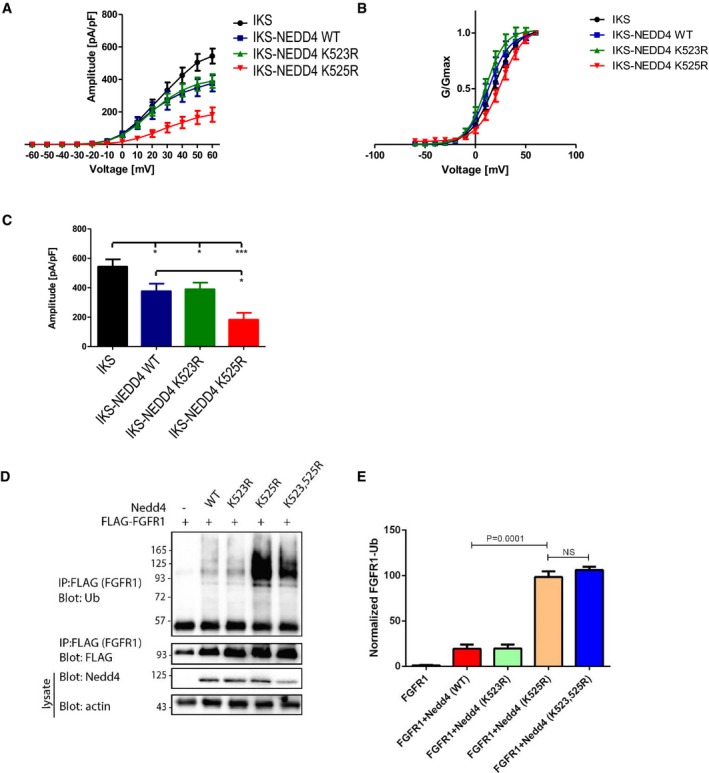
- A, B
Quantification (mean ± SEM) of (A) current‐voltage and (B) conductance‐voltage relationships of the recorded cells (n = 8–12), following co‐expression of IKS with Nedd4WT or mutants bearing individual lysine mutations, that is Nedd4K523R or Nedd4K525R. Cells were held at −90 mV. Membrane voltage was stepped for 3 s from −60 mV to +60 mV in 10 mV increments followed by repolarization to −60 mV for 1.5 s. Normalized conductance curves were fitted to a single Boltzmann function.
- C
Quantified (mean ± SEM) amplitude at −60 mV, for each cell type (n = 8–12). One‐way ANOVA; and Bonferroni's multiple comparison test; *P < 0.05, ***P < 0.001.
- D
Representative immunoblot of FGFR1 ubiquitylation (in the presence of serum) upon transfection of the indicated wild‐type and mutant human Nedd4 constructs.
- E
Quantified (mean ± SEM) ubiquitylated/total FGFR1 ratio from three separate experiments. P‐values are from Student's t‐test.
Comment in
-
Self-regulating ubiquitin ligases.EMBO J. 2017 Feb 15;36(4):392-393. doi: 10.15252/embj.201696154. Epub 2017 Jan 13. EMBO J. 2017. PMID: 28087580 Free PMC article.
References
-
- Abriel H, Staub O (2005) Ubiquitylation of ion channels. Physiology (Bethesda) 20: 398–407 - PubMed
-
- Armon A, Graur D, Ben‐Tal N (2001) ConSurf: an algorithmic tool for the identification of functional regions in proteins by surface mapping of phylogenetic information. J Mol Biol 307: 447–463 - PubMed
-
- Barhanin J, Lesage F, Guillemare E, Fink M, Lazdunski M, Romey G (1996) KvLQT1 and IsK (minK) proteins associate to form the IKS cardiac potassium current. Nature 384: 78–80 - PubMed
Publication types
MeSH terms
Substances
Grants and funding
LinkOut - more resources
Full Text Sources
Other Literature Sources
Molecular Biology Databases
Miscellaneous
