. 2017 Mar 31;37(8):e00592-16.
doi: 10.1128/MCB.00592-16. Print 2017 Apr 15.

Derepression of the DNA Methylation Machinery of the Gata1 Gene Triggers the Differentiation Cue for Erythropoiesis

Affiliations

Derepression of the DNA Methylation Machinery of the Gata1 Gene Triggers the Differentiation Cue for Erythropoiesis

Lei Yu et al. Mol Cell Biol. .

Abstract

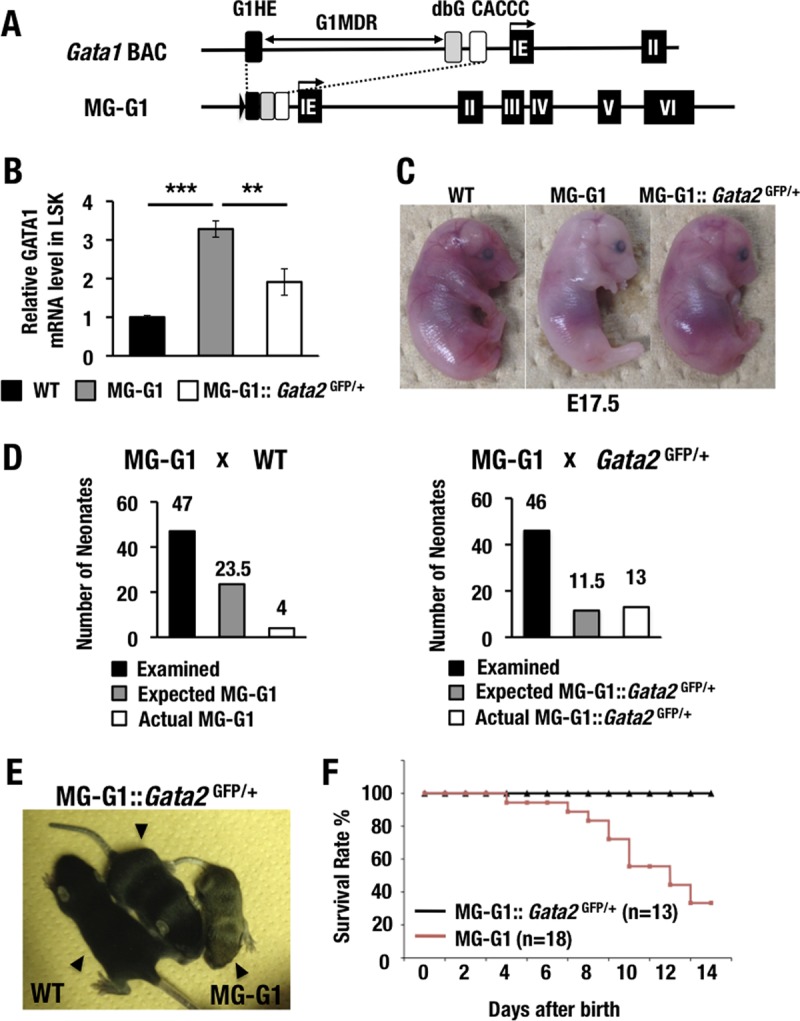
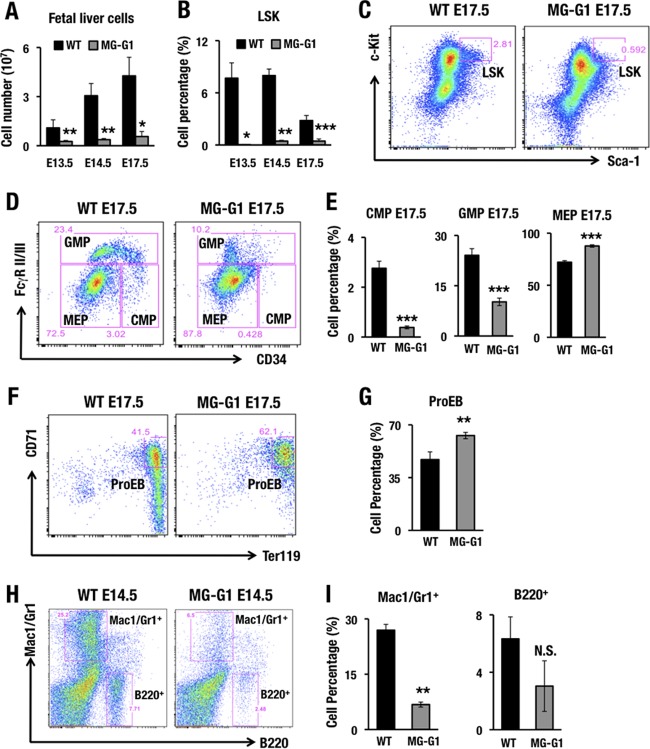
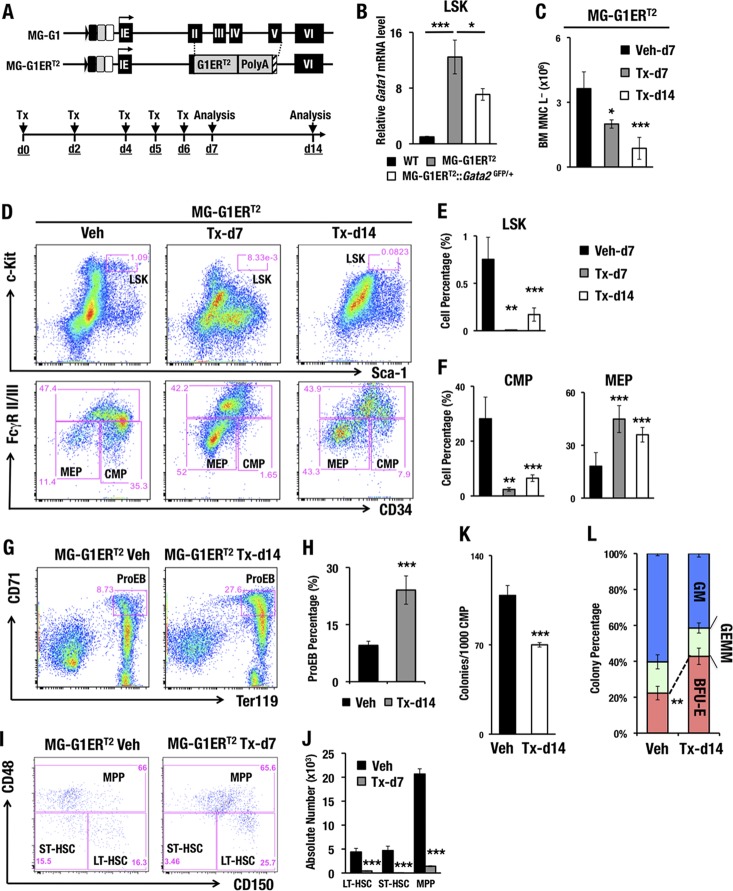
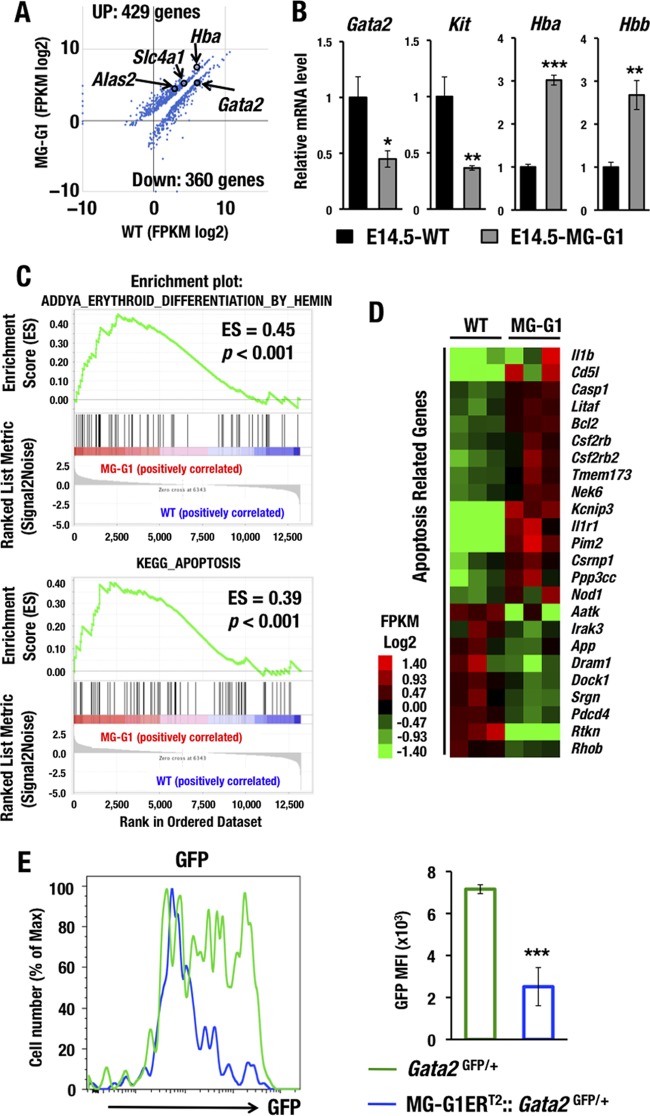
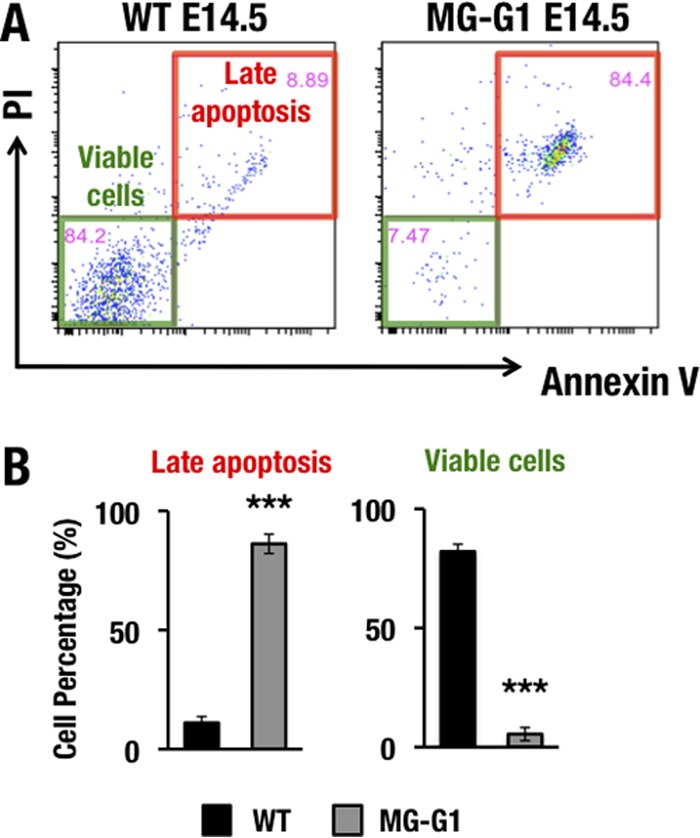
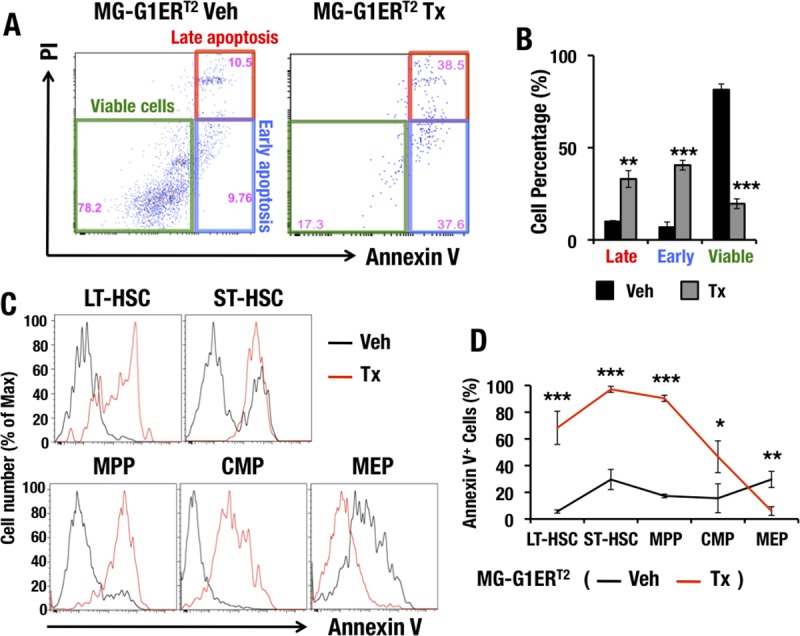
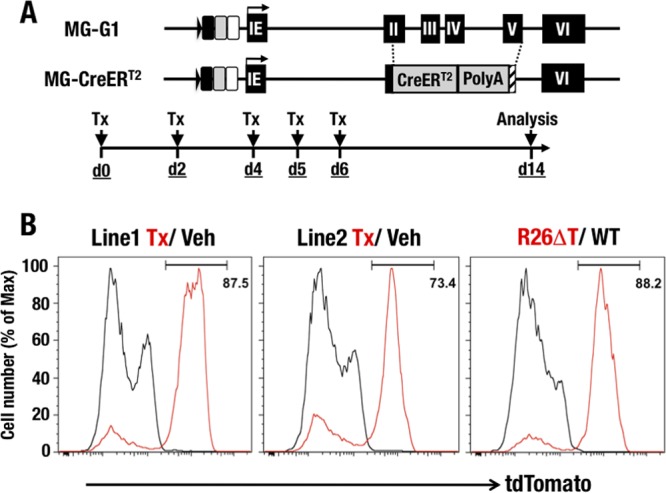
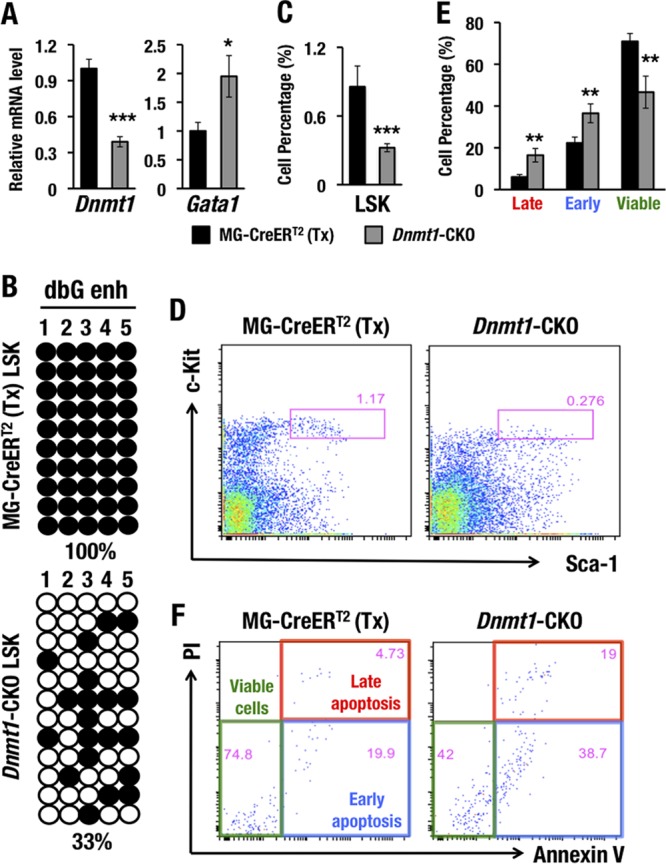
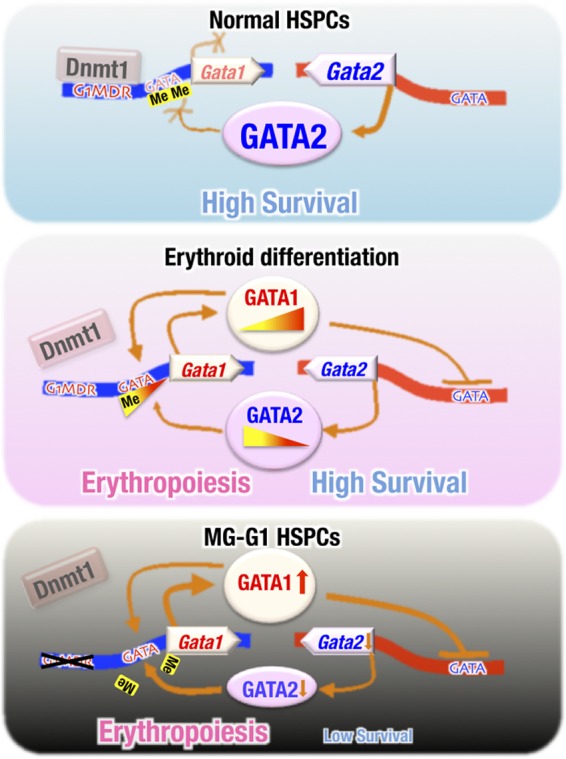
GATA1 is a critical regulator of erythropoiesis. While the mechanisms underlying the high-level expression of GATA1 in maturing erythroid cells have been studied extensively, the initial activation of the Gata1 gene in early hematopoietic progenitors remains to be elucidated. We previously identified a hematopoietic stem and progenitor cell (HSPC)-specific silencer element (the Gata1 methylation-determining region [G1MDR]) that recruits DNA methyltransferase 1 (Dnmt1) and provokes methylation of the Gata1 gene enhancer. In the present study, we hypothesized that removal of the G1MDR-mediated silencing machinery is the molecular basis of the initial activation of the Gata1 gene and erythropoiesis. To address this hypothesis, we generated transgenic mouse lines harboring a Gata1 bacterial artificial chromosome in which the G1MDR was deleted. The mice exhibited abundant GATA1 expression in HSPCs, in a GATA2-dependent manner. The ectopic GATA1 expression repressed Gata2 transcription and induced erythropoiesis and apoptosis of HSPCs. Furthermore, genetic deletion of Dnmt1 in HSPCs activated Gata1 expression and depleted HSPCs, thus recapitulating the HSC phenotype associated with GATA1 gain of function. These results demonstrate that the G1MDR holds the key to HSPC maintenance and suggest that release from this suppressive mechanism is a fundamental requirement for subsequent initiation of erythroid differentiation.

Keywords: Gata1 gene regulation; erythropoiesis; hematopoietic stem and progenitor cell.


Figures

FIG 1
FIG 1
GATA2 transactivates GATA1 in the HSPCs of MG-G1 mice, and haploid insufficiency of the Gata2 gene rescues MG-G1 mice from perinatal lethality. (A) Structure of MG-G1 BAC DNA. The G1MDR sequence was deleted in the context of Gata1 BAC DNA. The three regulatory elements of the Gata1 gene, shown as black (G1HE), gray (dbG), and white (CACCC) rectangles, were combined to generate MG-G1. IE, erythroid cell-specific 1st exon of the Gata1 gene. (B) Gata1 mRNA levels in LSK cells from E14.5 livers. Note that MG-G1 embryos showed 3.3-fold more Gata1 mRNA but that the increase was abrogated by Gata2 haploid insufficiency. WT, wild type. (C) Pale appearance of an MG-G1 embryo compared to that of a wild-type littermate embryo at E17.5. The anemic appearance was rescued by the reduction of GATA2 abundance. (D) Genotyping results for neonates born from crosses of MG-G1 and wild-type mice (left) or MG-G1 and Gata2GFP/+ mice (right). The total numbers of neonates examined, the Mendelian expected numbers, and the actual numbers of neonates born alive are shown. (E) Retarded growth of MG-G1 neonates was rescued by Gata2 haploid insufficiency. (F) Kaplan-Meier survival curves for MG-G1 and MG-G1::Gata2GFP/+ mice after birth. The numbers of mice examined in this cohort were 18 and 13 for MG-G1 and MG-G1::Gata2GFP/+ mice, respectively. Data shown are the means ± SD for three mice. **, P < 0.01; ***, P < 0.001 (unpaired Student's t test).
FIG 2
FIG 2
MG-G1 BAC transgenic mice exhibit enhanced erythropoiesis and HSPC depletion during the embryonic stage. (A) Fetal liver cellularity in E13.5, E14.5, and E17.5 embryos. Note that MG-G1 fetal livers showed a significant reduction in the hematopoietic cell population compared to that in wild-type fetal livers. (B) Percentages of LSK cells in E13.5, E14.5, and E17.5 fetal livers of MG-G1 and littermate control embryos. (C and D) Flow cytometry analysis of LSK cell (C) and progenitor (D) fractions. (E) CMP, GMP, and MEP percentages in E17.5 fetal livers of MG-G1 and littermate control embryos. (F) Flow cytometry analysis of proerythroblasts from WT and MG-G1 E17.5 fetal livers. (G) Percentages of CD71+ Ter119+ proerythroblasts in E17.5 livers. (H) Flow cytometry analysis of Mac1/Gr1+ and B220+ cells from WT and MG-G1 E14.5 fetal livers. (I) Percentages of Mac1/Gr1+ and B220+ cells. Data shown are the means ± SD for three to six mice. *, P < 0.05; **, P < 0.01; ***, P < 0.001 (unpaired Student's t test). N.S., not significant.
FIG 3
FIG 3
Increased erythropoiesis and HSPC depletion in the adult bone marrows of MG-G1ERT2 mice upon tamoxifen treatment. (A) Structure of the MG-G1ERT2 BAC transgenic construct. The G1ERT2 fusion cDNA was integrated by homologously replacing the 2nd to 5th exons of the Gata1 gene in the MG-G1 BAC DNA. (Top) Transgenic mice were generated using the MG-G1ERT2 BAC construct. (Bottom) Tamoxifen (Tx) was injected intraperitoneally into the mice on days 0, 2, 4, 5, and 6. The analysis was performed on days 7 and 14. (B) Gata1 mRNA levels in LSK cells from WT, MG-G1ERT2, and MG-G1ERT2::Gata2GFP/+ bone marrows from adult mice without tamoxifen treatments. (C) Number of bone marrow lineage-negative mononuclear cells (BM MNC L) in vehicle (Veh)- or tamoxifen-treated MG-G1ERT2 mice at day 7 or 14. (D) Flow cytometry analysis of LSK cells (upper panels) and progenitors (lower panels) in MG-G1ERT2 mice treated with vehicle (left) or with tamoxifen for 7 days (middle) or 14 days (right). (E and F) Percentages of LSK cell (E) and CMP and MEP (F) populations. Note that after tamoxifen treatment, the percentages of LSK cells and CMPs were significantly reduced, while that of MEP was increased. (G) Flow cytometry analysis of proerythroblasts from MG-G1ERT2 mouse bone marrow 14 days after vehicle or tamoxifen treatment. (H) Percentages of CD71+ Ter119+ proerythroblast cells. (I) LT-HSC, ST-HSC, and MPP populations were separated by means of flow cytometry from LSK-gated adult bone marrow cells from MG-G1ERT2 mice 7 days after vehicle (left) or tamoxifen (right) treatment. (J) Absolute numbers of the LT-HSC, ST-HSC, and MPP subsets. Note the significant decreases in LT-HSC, ST-HSC, and MPP populations in LSK-gated MG-G1ERT2 mouse bone marrow cells. (K and L) Colony number per 1,000 CMP cells (K) and percentages of CFU-GM, CFU-GEMM, and BFU-E colonies (L) from vehicle- or tamoxifen-treated MG-G1ERT2 mice. Data shown are the means ± SD for three to seven mice. *, P < 0.05; **, P < 0.01; ***, P < 0.001 (unpaired Student's t test).
FIG 4
FIG 4
GATA1 dysregulation changes the HSPC gene signature to erythroid differentiation and apoptotic cell death. (A) Scatterplots comparing transcript levels (in fragments per kilobase of exon per million fragments [FPKM]) in wild-type (x axis) and MG-G1 (y axis) mice. Only data for significantly changed genes are shown (P < 0.05). (B) mRNA levels of GATA1 target genes as assessed by manual RT-qPCR using E14.5 LSK cells from livers of wild-type and MG-G1 embryos. (C) GSEA of erythroid differentiation- and apoptosis-related data sets for all RNA-Seq reads of LSK RNAs from MG-G1 and wild-type littermate adult bone marrow cells. (D) Heat map showing relative expression levels of apoptosis-related genes in MG-G1 LSK cells compared to wild-type LSK cells. Heat map colors indicate normalized expression levels. (E) GFP mean fluorescence intensities (MFI) in LSK-gated fractions from Gata2GFP/+ and MG-G1ERT2::Gata2GFP/+ mice after tamoxifen treatment. Note the decrease of GFP MFI in MG-G1ERT2::Gata2GFP/+ mice. Data shown are the means ± SD for three mice. *, P < 0.05; **, P < 0.01; ***, P < 0.001 (unpaired Student's t test).
FIG 5
FIG 5
Gata1 gene derepression induces HSPC apoptosis in the MG-G1 fetal liver. (A) PI and annexin V staining of LSK-gated cells from wild-type (left) and MG-G1 (right) E14.5 fetal livers. Note that the late apoptosis fraction was significantly increased in LSK-gated cells from MG-G1 fetal livers, while viable cells were predominant in LSK-gated cells from wild-type fetal livers. (B) Percentages of late apoptotic (PI+ annexin V+) and viable (PI annexin V) LSK cells in wild-type and MG-G1 fetal livers. Data shown are the means ± SD for three mice. ***, P < 0.001 (unpaired Student's t test).
FIG 6
FIG 6
Ectopic GATA1 activation induces HSPC apoptosis but prevents programmed cell death of erythroid and megakaryocytic committed cells. (A) PI and annexin V staining of LSK-gated cells from MG-G1ERT2 mouse bone marrow after vehicle treatment (left) or 7 days of tamoxifen treatment (right). (B) Percentages of late apoptotic, early apoptotic, and viable adult bone marrow LSK cells. (C) Flow cytometry analysis of annexin V staining in LT-HSCs, ST-HSCs, MPPs, CMPs, and MEPs from MG-G1ERT2 mouse bone marrow 7 days after vehicle or tamoxifen treatment. (D) Percentages of annexin V+ apoptotic cells based on the data from panel C. Data shown are the means ± SD for three or four mice. *, P < 0.05; **, P < 0.01; ***, P < 0.001 (unpaired Student's t test).
FIG 7
FIG 7
Generation of MG-CreERT2 mice. (A) Structure of the MG-CreERT2 BAC transgenic allele. The CreERT2 fusion cDNA was integrated by homologously replacing the 2nd to 5th exon regions of the Gata1 gene in the MG-G1 BAC DNA. Tamoxifen was administered to the mice by intraperitoneal injection on days 0, 2, 4, 5, and 6. Analysis was performed on day 14. (B) tdTomato histograms confirming Cre activity in the LSK fractions of R26T::MG-CreERT2 and control mice. (Left) R26T::MG-CreERT2 line 1 (red line, tamoxifen; black line, vehicle). (Middle) R26T::MG-CreERT2 line 2 (red line, tamoxifen; black line, vehicle). (Right) R26ΔT positive control (red line) and WT negative control (black line).
FIG 8
FIG 8
Dnmt1 deletion induces Gata1 expression and subsequently depletes HSPCs. (A) Dnmt1 and Gata1 mRNA levels in the LSK fractions from MG-CreERT2 and Dnmt1-CKO mouse bone marrows 14 days after tamoxifen treatment. (B) Bisulfite sequencing of the dbG enhancer (dbG enh) in LSK cells from MG-CreERT2 and Dnmt1-CKO adult mouse bone marrows 14 days after tamoxifen treatment. (C and D) LSK percentages (C) and LSK flow cytometry (D) for MG-CreERT2 and Dnmt1-CKO mice after tamoxifen treatment. (E and F) Late apoptotic, early apoptotic, and viable LSK cell percentages (E) and annexin V-PI staining of LSK-gated cells (F) for MG-CreERT2 and Dnmt1-CKO adult mouse bone marrows 14 days after tamoxifen treatment. Note that conditional knockout of Dnmt1 induced GATA1 expression and reduced the total LSK population and the number of viable LSK cells. Data shown are the means ± SD for three to five mice. *, P < 0.05; **, P < 0.01; ***, P < 0.001 (unpaired Student's t test).
FIG 9
FIG 9
Dnmt1 and the G1MDR cis-acting repressor element maintain the HSPC balance between erythropoiesis initiation and cell survival. (Top) Under normal conditions, G1MDR-mediated Dnmt1 recruitment and methylation of the Gata1 gene enhancer and the upstream promoter regions repress Gata1 gene expression in HSPCs, which maintains HSPC homeostasis. (Middle) During erythroid differentiation, the Dnmt1-G1MDR-mediated DNA methylation of the Gata1 enhancer is gradually reduced (in contrast to the total loss caused by G1MDR deletion). The decreased methylation allows GATA2 to initiate Gata1 transcription gradually during the initiation of erythropoiesis. The progressively enhanced level of GATA1 then transactivates the expression of the Gata1 gene itself (autoregulation) and represses Gata2 gene expression, thus directing the progress of erythropoiesis. (Bottom) Upon deletion of the G1MDR, the epigenetic repression of Gata1 gene expression is completely abrogated such that GATA2 is able to fully transactivate Gata1 gene expression in HSPCs. The aberrant GATA1 activation represses the Gata2 gene and accelerates HSPC depletion through inducing erythroid differentiation and apoptosis.

Similar articles

Cited by

References

    1. Takahashi S, Onodera K, Motohashi H, Suwabe N, Hayashi N, Yanai N, Nabesima Y, Yamamoto M. 1997. Arrest in primitive erythroid cell development caused by promoter-specific disruption of the GATA-1 gene. J Biol Chem 272:12611–12615. doi:10.1074/jbc.272.19.12611. - DOI - PubMed
    1. Takahashi S, Komeno T, Suwabe N, Yoh K, Nakajima O, Nishimura S, Kuroha T, Nagasawa T, Yamamoto M. 1998. Role of GATA-1 in proliferation and differentiation of definitive erythroid and megakaryocytic cells in vivo. Blood 92:434–442. - PubMed
    1. Zon LI, Yamaguchi Y, Yee K, Albee EA, Kimura A, Bennett JC, Orkin SH, Ackerman SJ. 1993. Expression of mRNA for the GATA-binding proteins in human eosinophils and basophils: potential role in gene transcription. Blood 81:3234–3241. - PubMed
    1. Martin DI, Zon LI, Mutter G, Orkin SH. 1990. Expression of an erythroid transcription factor in megakaryocytic and mast cell lineages. Nature 344:444–447. doi:10.1038/344444a0. - DOI - PubMed
    1. Shimizu R, Engel JD, Yamamoto M. 2008. GATA1-related leukaemias. Nat Rev Cancer 8:279–287. doi:10.1038/nrc2348. - DOI - PubMed

Publication types

MeSH terms

LinkOut - more resources