. 2017 Feb 23;85(3):e00915-16.
doi: 10.1128/IAI.00915-16. Print 2017 Mar.

Interaction of the CD43 Sialomucin with the Mycobacterium tuberculosis Cpn60.2 Chaperonin Leads to Tumor Necrosis Factor Alpha Production

Affiliations

Interaction of the CD43 Sialomucin with the Mycobacterium tuberculosis Cpn60.2 Chaperonin Leads to Tumor Necrosis Factor Alpha Production

Alvaro Torres-Huerta et al. Infect Immun. .

Abstract

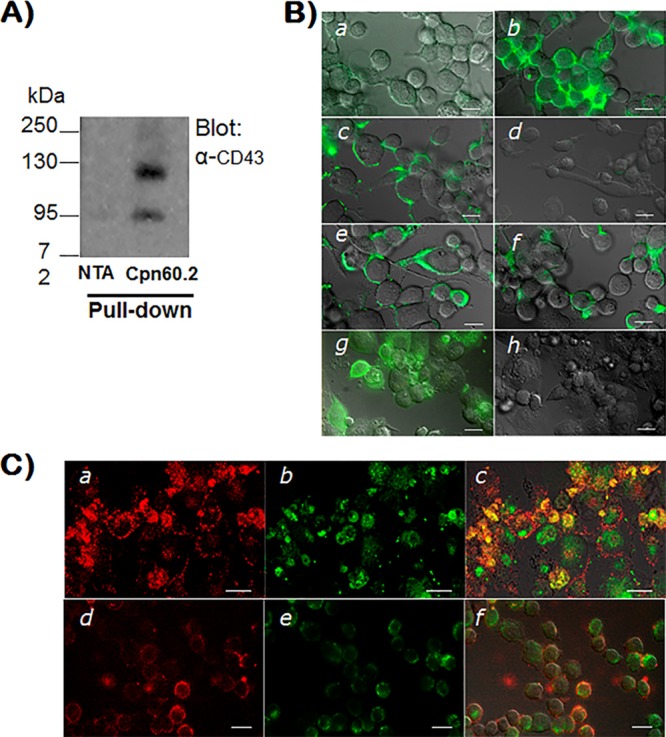
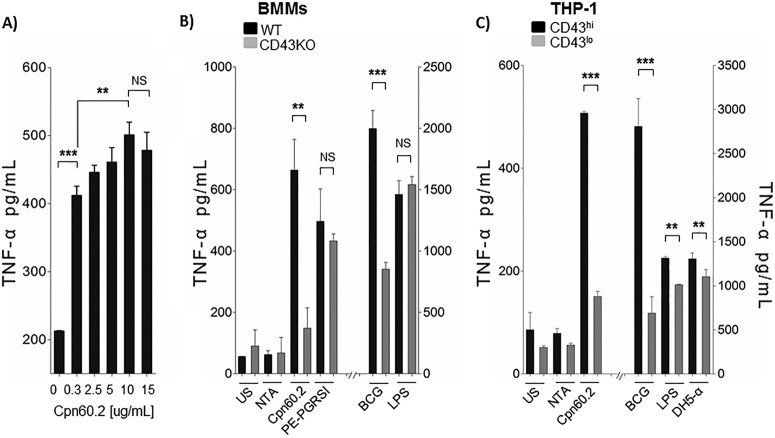
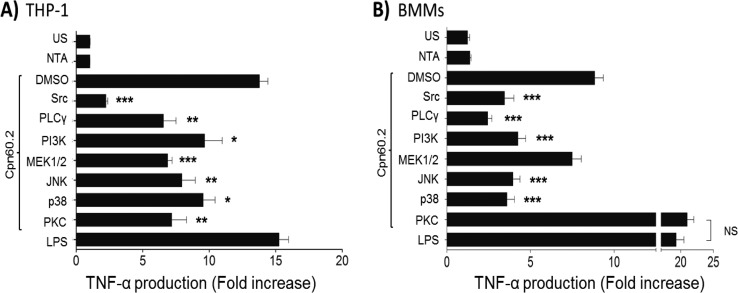
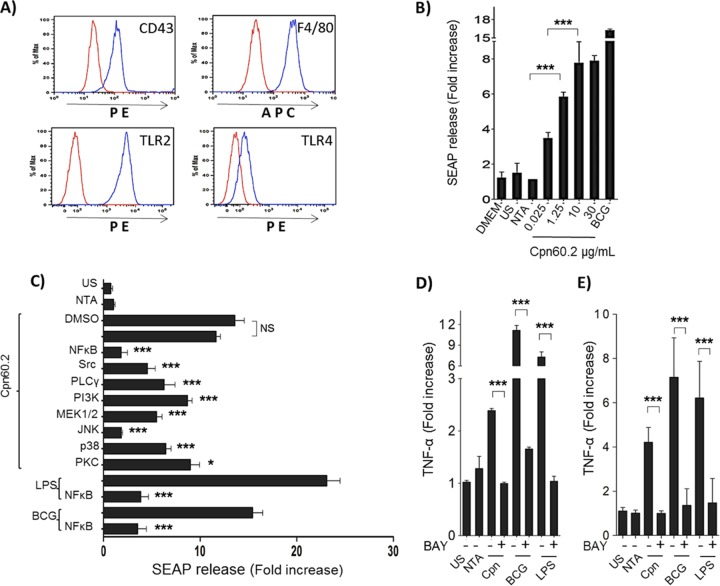
Mycobacterium tuberculosis is the causal agent of tuberculosis. Tumor necrosis factor alpha (TNF-α), transforming growth factor β (TGF-β), and gamma interferon (IFN-γ) secreted by activated macrophages and lymphocytes are considered essential to contain Mycobacterium tuberculosis infection. The CD43 sialomucin has been reported to act as a receptor for bacilli through its interaction with the chaperonin Cpn60.2, facilitating mycobacterium-macrophage contact. We report here that Cpn60.2 induces both human THP-1 cells and mouse-derived bone marrow-derived macrophages (BMMs) to produce TNF-α and that this production is CD43 dependent. In addition, we present evidence that the signaling pathway leading to TNF-α production upon interaction with Cpn60.2 requires active Src family kinases, phospholipase C-γ (PLC-γ), phosphatidylinositol 3-kinase (PI3K), p38, and Jun N-terminal protein kinase (JNK), both in BMMs and in THP-1 cells. Our data highlight the role of CD43 and Cpn60.2 in TNF-α production and underscore an important role for CD43 in the host-mycobacterium interaction.

Keywords: CD43; Cpn60.2; Mycobacterium tuberculosis; cell signaling; macrophages; tumor necrosis factor alpha.


Figures

FIG 1
FIG 1
Cpn60.2 interacts with CD43 on the cell surface. (A) Cell lysates (300 μg) of WT PMA-differentiated THP-1 cells were incubated with 200 μg of Cpn60.2-His-loaded Ni-NTA beads or empty Ni-NTA beads (12 h at 4°C). The beads were then extensively washed with lysis buffer and subjected to 10% SDS-PAGE; proteins were transferred to nitrocellulose and immunoblotted with the anti-CD43 MAb L10. Data are representative of those from at least five independent experiments. (B) Differentiated THP-1 cells were incubated with streptavidin-Alexa Fluor 488 (a), His-Cpn60.2-biotin (1 μg/ml) followed by streptavidin-Alexa Fluor 488 (b), His-Cpn60.2-biotin (1 μg/ml) and a 10-fold excess of His-Cpn60.2 followed by streptavidin-Alexa Fluor 488 (c), His-Cpn60.2-biotin (1 μg/ml) and a 15-fold excess of His-Cpn60.2 followed by streptavidin-Alexa Fluor 488 (d), His-PE_PGRS1-biotin (1 μg/ml) followed by streptavidin-Alexa Fluor 488 (e), anti-CD43 MAb L10 (1 μg/ml) (30 min for 37°C) followed by His-Cpn60.2-biotin (1 μg/ml) for an additional 30 min and streptavidin-Alexa Fluor 488 (f), MAb L10 followed by Alexa Fluor 488 rabbit anti-mouse IgG (g), and Alexa Fluor 488 rabbit anti-mouse IgG (h). Scale bars, 20 μm. Data are representative of those from three independent experiments. (C) Differentiated THP-1 cells (a to c) or RAW-Blue cells (d to f) were incubated with recombinant purified His-Cpn60.2-biotin followed by streptavidin-Alexa Fluor 488 (b and e), fixed, and further incubated with anti-CD43 MAb DFT-1-PE (a and d); the merged images show the colocalization of the two proteins (c and f). Panels a to c show confocal imaging; panels d to f show epifluorescence imaging. Scale bars, 20 μm. Data are representative of those from at least three independent experiments.
FIG 2
FIG 2
Cpn60.2 leads to TNF-α production in a CD43-dependent way. (A) BMMs (1 × 10⁵/well) were challenged with 20 μl of Ni-NTA beads loaded with the indicated concentrations of Cpn60.2 (12 h at 37°C); the release of TNF-α to the culture supernatant was assessed by ELISA. Data are representative of those from at least three independent experiments. Statistical analysis was conducted with a paired t test. ***, P ≤ 0.0001; **, P ≤ 0.0041. NS, not significant. (B) BMMs (1 × 10⁵/well) derived from C57BL/6J CD43−/− or their heterozygote littermates were activated with Cpn60.2- or PE_PGRS1-Ni-NTA beads at 10 μg/ml, Ni-NTA beads, BCG (MOI, 4:1), or LPS (500 ng/ml) for 12 h at 37°C and 5% CO2. Supernatants were collected and TNF-α was quantified by ELISA. Data are representative of those from at least three independent experiments. Statistical analysis was conducted with a paired t test. ***, P ≤ 0.0001; **, P ≤ 0.0048. (C) PMA-differentiated macrophages from CD43lo THP-1 cells or mock-transfected cells (CD43hi) were seeded in 96-well plates (1 × 10⁵/well) and challenged with the following: Cpn60.2-Ni-NTA beads, BCG (MOI, 4:1), LPS (500 ng/ml), or E. coli DH5α (MOI, 10:1) for 12 h at 37°C and 5% CO2. Supernatants were collected and TNF-α was quantified by ELISA. As controls, unloaded Ni-NTA beads and nonstimulated cells (US) were used in parallel. Data are representative of at least three independent experiments. Statistical analysis was conducted with a paired t test. ***, P ≤ 0.0002; **, P ≤ 0.0031.
FIG 3
FIG 3
The Src family kinases, PLC-γ, PI3K, MAPKs, and PKC are implicated in TNF-α release in response to Cpn60.2. PMA-differentiated THP-1 macrophages (A) or BMMs (B) were seeded into 96-well plates (1 × 10⁵ cells/well) and incubated in presence or absence of selective inhibitors of PLC-γ, PI3K, MAPKs (p38, ERK, and JNK), and PKC for 1 h prior to challenge with Cpn60.2 (10 μg/ml) for 12 h at 37°C and 5% CO2. Supernatants were collected and the amount of TNF-α was measured by ELISA. Data from three independent experiments, each done in triplicate, are shown. Data are shown as fold increase compared to value obtained with Ni-NTA beads. Statistical analysis was conducted with a paired t test. ***, P ≤ 0.0007; **, P ≤ 0.081; *, P ≤ 0.0488.
FIG 4
FIG 4
Cpn60.2 leads to NF-κB and AP-1 activation and TNF-α production. (A) RAW-Blue cells expressing an inducible embryonic alkaline phosphatase reporter gene (SEAP) under the control of NF-κB and AP-1 were stained for TLR4, TLR2, F4/80, and CD43 with specific MAbs and analyzed by flow cytometry. (B) RAW-Blue cells seeded into 96-well plates (1 × 10⁵ cells/well) were challenged with different concentrations of Cpn60.2-loaded beads for 12 h at 37°C; activation of NF-κB or AP-1 was evaluated through SEAP activity in the culture supernatants. (C) RAW-Blue cells were seeded into 96-well plates (1 × 10⁵ cells/well), incubated in the presence or absence of selective inhibitors of NF-κB, p38 MAPK, JNK, and pan-PKC 1 h prior to challenge with Cpn60.2-NTA beads (10 μg/ml), Ni-NTA beads, BCG (ratio of bacteria to cells, 4:1), or LPS (500 ng/ml) for 12 h at 37°C and 5% CO2. SEAP activity was measured in the supernatant to assess NF-κB or AP-1 activation. (D) BMMs from 4- to 6-week-old male C57BL/6 WT mice were seeded into 96-well plates (1 × 10⁵ cells/well) and incubated in the presence or absence of the NF-κB inhibitor BAY117082 1 h prior to challenge with Cpn60.2-coupled beads (10 μg/ml), Ni-NTA beads, BCG (ratio of bacteria to cells, 4:1), or LPS (500 ng/ml) for 12 h at 37°C and 5% CO2. The supernatant was collected and TNF-α was measured by ELISA. (E) PMA-differentiated THP-1 cells were seeded into 96-well plates (1 × 10⁵ cells/well) and incubated in the presence or absence of the NF-κB inhibitor BAY117082 1 h prior to challenge with Cpn60.2-loaded Ni-NTA beads (10 μg/ml), NTA-nickel beads, BCG (ratio of bacteria to cells, 4:1), or LPS (500 ng/ml) for 12 h at 37°C and 5% CO2. The supernatant was collected and TNF-α was measured by ELISA. For all graphs, data represent those from three independent experiments each done in triplicate. Data are shown as fold increase compared to value obtained with Ni-NTA beads. Statistical analysis was conducted with a paired t test. ***, P ≤ 0.0007; *, P ≤ 0.0488.

Similar articles

Cited by

References

    1. Kaufmann SH. 2002. Protection against tuberculosis: cytokines, T cells, and macrophages. Ann Rheum Dis 61(Suppl 2):ii54–ii58. doi: 10.1136/ard.61.suppl_2.ii54. - DOI - PMC - PubMed
    1. Hossain MM, Norazmi MN. 2013. Pattern recognition receptors and cytokines in Mycobacterium tuberculosis infection—the double-edged sword? Biomed Res Int 2013:179174. - PMC - PubMed
    1. Shaler CR, Horvath CN, Jeyanathan M, Xing Z. 2013. Within the enemy's camp: contribution of the granuloma to the dissemination, persistence and transmission of Mycobacterium tuberculosis. Front Immunol 4:30. - PMC - PubMed
    1. Sasindran SJ, Torrelles JB. 2011. Mycobacterium tuberculosis infection and inflammation: what is beneficial for the host and for the bacterium? Front Microbiol 2:2. - PMC - PubMed
    1. Gaynor CD, McCormack FX, Voelker DR, McGowan SE, Schlesinger LS. 1995. Pulmonary surfactant protein A mediates enhanced phagocytosis of Mycobacterium tuberculosis by a direct interaction with human macrophages. J Immunol 155:5343–5351. - PubMed

Publication types

LinkOut - more resources