. 2017 Feb 8;37(6):1591-1603.
doi: 10.1523/JNEUROSCI.2945-16.2016. Epub 2017 Jan 9.

Posterior α EEG Dynamics Dissociate Current from Future Goals in Working Memory-Guided Visual Search

Affiliations

Posterior α EEG Dynamics Dissociate Current from Future Goals in Working Memory-Guided Visual Search

Ingmar E J de Vries et al. J Neurosci. .

Abstract

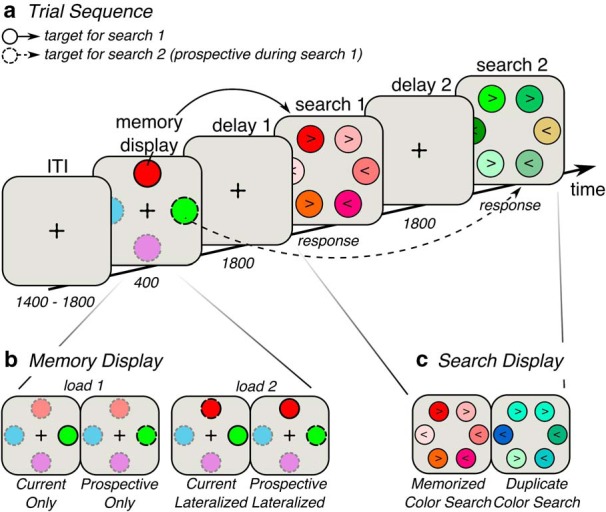
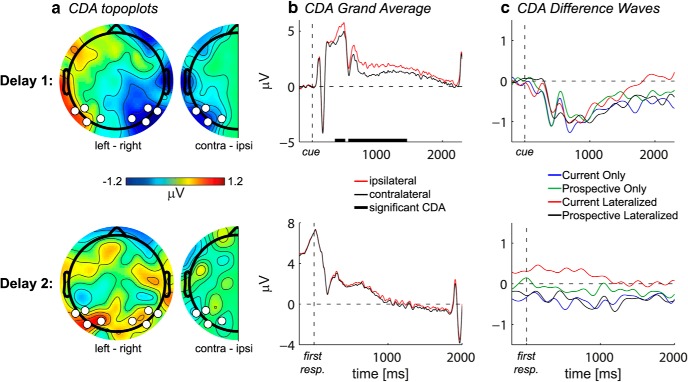
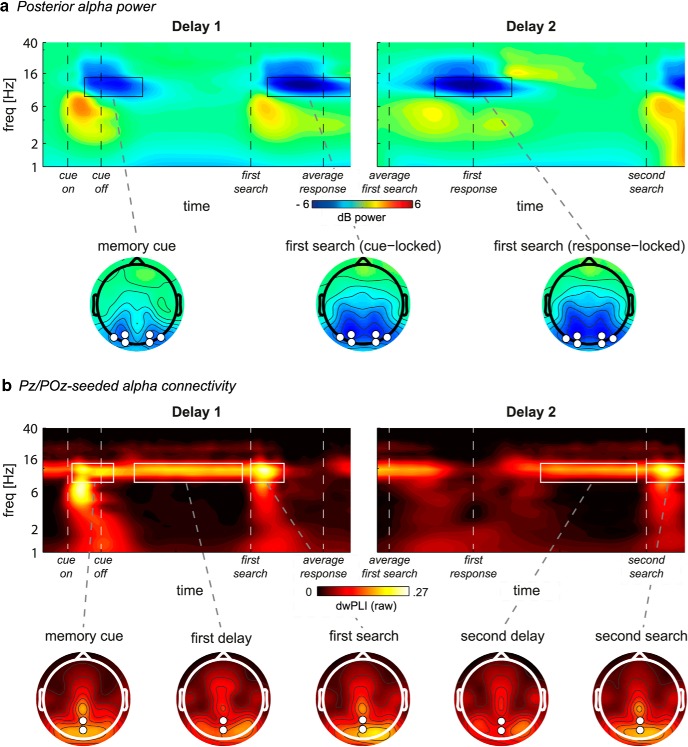
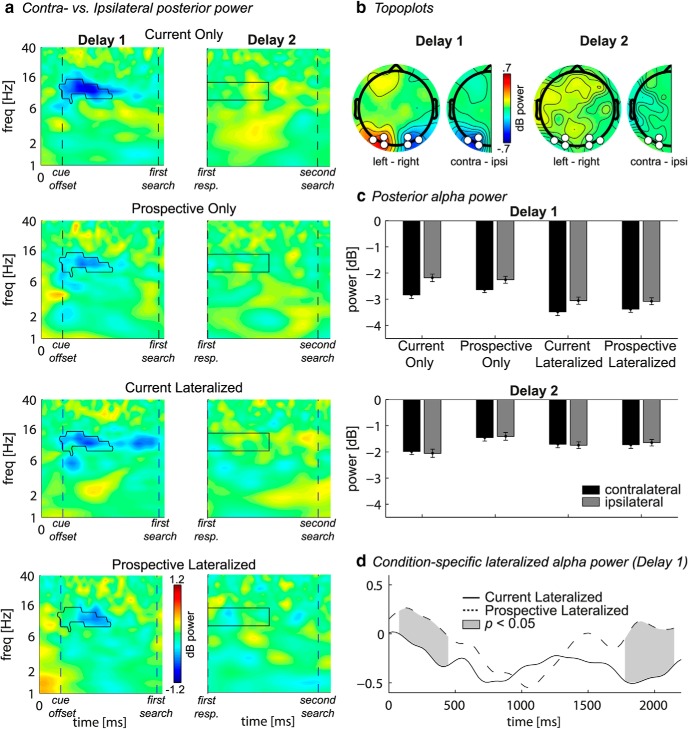
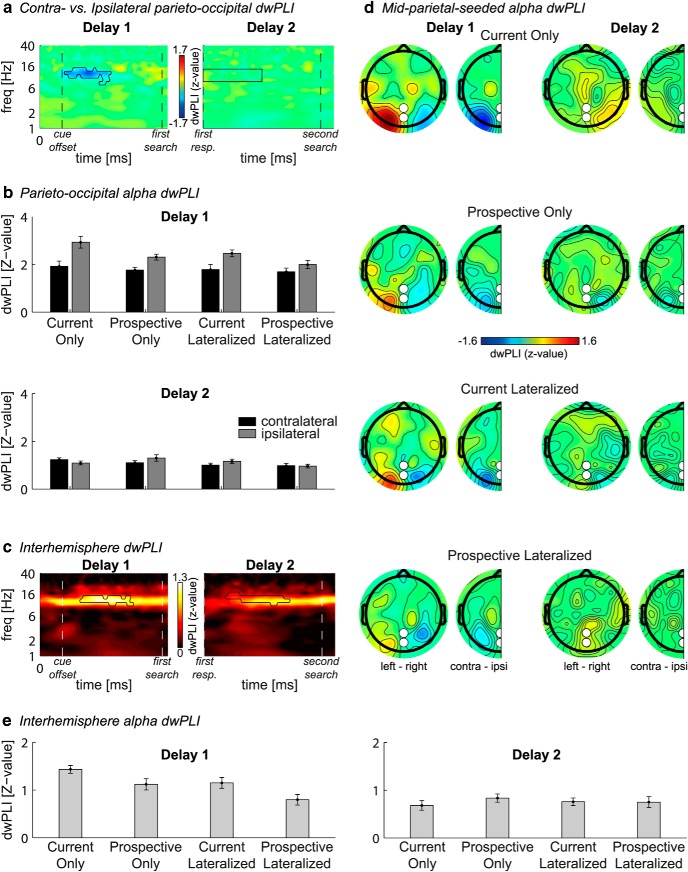
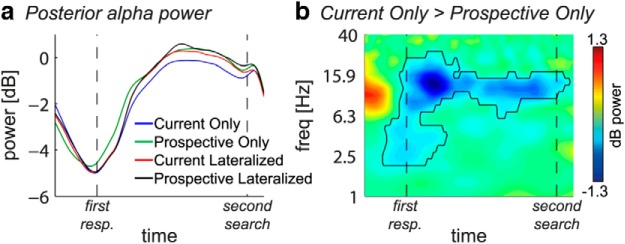
Current models of visual search assume that search is guided by an active visual working memory representation of what we are currently looking for. This attentional template for currently relevant stimuli can be dissociated from accessory memory representations that are only needed prospectively, for a future task, and that should be prevented from guiding current attention. However, it remains unclear what electrophysiological mechanisms dissociate currently relevant (serving upcoming selection) from prospectively relevant memories (serving future selection). We measured EEG of 20 human subjects while they performed two consecutive visual search tasks. Before the search tasks, a cue instructed observers which item to look for first (current template) and which second (prospective template). During the delay leading up to the first search display, we found clear suppression of α band (8-14 Hz) activity in regions contralateral to remembered items, comprising both local power and interregional phase synchronization within a posterior parietal network. Importantly, these lateralization effects were stronger when the memory item was currently relevant (i.e., for the first search) compared with when it was prospectively relevant (i.e., for the second search), consistent with current templates being prioritized over future templates. In contrast, event-related potential analysis revealed that the contralateral delay activity was similar for all conditions, suggesting no difference in storage. Together, these findings support the idea that posterior α oscillations represent a state of increased processing or excitability in task-relevant cortical regions, and reflect enhanced cortical prioritization of memory representations that serve as a current selection filter.SIGNIFICANCE STATEMENT Our days are filled with looking for relevant objects while ignoring irrelevant visual information. Such visual search activity is thought to be driven by current goals activated in working memory. However, working memory not only serves current goals, but also future goals, with differential impact upon visual selection. Little is known about how the brain differentiates between current and future goals. Here we show, for the first time, that modulations of brain oscillations in the EEG α frequency band in posterior cortex can dissociate current from future search goals in working memory. Moreover, the dynamics of these oscillations uncover how we flexibly switch focus between memory representations. Together, we reveal how the brain assigns priority for selection.

Keywords: EEG; priority; selective attention; states; visual search template; visual working memory.


Figures

Figure 1.
Figure 1.
Task design. a, Trial sequence. Participants were presented with two consecutive search displays. Before the search displays, participants were given a memory display indicating which targets to look for in the subsequent search displays. b, There were four types of memory display. In Load 1 conditions, only one target had to be remembered, and it was either designated as the target for the first search (current only; indicated by a solid outline) or for the second search (and thus was prospective during the first search; indicated by a dashed outline). The relevant item was always lateralized. In this case, the remaining search display did not contain a predefined target, and no working memory was required. Instead, in those displays, observers searched for any duplicate color, as illustrated in c. In Load 2 conditions, observers always memorized two items: one for the first search (currently relevant item; solid outline) and one for the second (prospectively relevant item; dashed outline). Either the currently relevant item was lateralized or the prospectively relevant item was lateralized, whereas the other item was presented on the meridian. ITI, Intertrial interval. Object sizes and colors differ from the real experiment, and the opacity for the irrelevant colors in the memory display is set at 50% for illustrative purposes.
Figure 2.
Figure 2.
CDA. a, The grand average scalp distribution of the CDA averaged over the time interval in which the CDA was significant in the first delay period. Full topographies, ERPs of trials with the lateralized memory item on the right subtracted from those with the memory item on the left. Half topographies, ERPs at ipsilateral electrodes subtracted from those at contralateral electrodes, collapsed across hemispheres. White dots indicate electrodes of which activity is plotted in b and c. b, The grand average ERPs at the average of P5/6, P7/8, PO3/4, and PO7/8, contralateral (black) and ipsilateral (red) to the lateralized memory item. The ERPs were low-pass filtered at 40 Hz. Thick black line on the x-axis indicates the time period during which the difference between the contralateral and ipsilateral ERPs was significant at p < 0.05 cluster-corrected. c, The CDA per condition, calculated as the ERP contralateral minus ipsilateral to the lateralized memory item. The difference waves were low-pass filtered at 5 Hz for visualization purposes. First and second row are first and second delay, respectively.
Figure 3.
Figure 3.
Overall task-related power and connectivity. a, Top, Grand average time-frequency plots of power at the average of O1/2, PO3/4, and PO7/8, for first (left) and second (right) delay. Bottom, Grand average scalp distributions of α power (8–14 Hz) averaged over the time-frequency windows highlighted by black outlines in the time-frequency plots. Each task display is followed by overall posterior α suppression relative to baseline. b, Top, Grand average time-frequency plots of connectivity (raw dwPLI) between the six lateral posterior electrodes O1/2, PO3/4, and PO7/8 and the parietal Pz/POz electrodes, for first (left) and second (right) delay. Bottom, Grand average scalp distributions of α connectivity (8–14 Hz) averaged over the time-frequency windows highlighted by white outlines in the time-frequency plots. Connectivity in the topographical maps is calculated between each electrode and Pz/POz combined. a, b, First delay is locked to memory display onset. Second delay is locked to first response, which coincides with second delay onset.
Figure 4.
Figure 4.
Lateralized posterior α power. a, Time-frequency plots per condition (rows) of contralateral minus ipsilateral power at the average of O1/2, PO3/4, and PO7/8 for the first and second delay (columns). Black outline indicates significant power difference between contralateral and ipsilateral in grand average at p < 0.01, cluster corrected. For the first delay, t = 0, t = 400, and t = 2200 indicate the memory display onset, start of first delay, and end of first delay, respectively. For the second delay, t = 0 and t = 1800 indicate the start and end of second delay, respectively. b, Full topographies, Grand average scalp distributions of α power on trials with the lateralized memory item on the right subtracted from those with the memory item on the left. Half topographies, Grand average scalp distributions of α power at ipsilateral electrodes subtracted from those at contralateral electrodes, collapsed across hemispheres. Power was averaged over the significant time-frequency cluster (first delay) or averaged over a window of 0–1000 ms by 8–14 Hz (second delay) (see a, black outline). c, Bars per condition of contralateral (black) and ipsilateral (gray) power averaged over the time-frequency cluster highlighted in a. Error bars indicate SEM for normalized data. d, Time series of contralateral minus ipsilateral α power during the first delay for the conditions where both the currently relevant and prospectively relevant item had to be remembered. Gray areas between the curves represent time points with a significant difference between the conditions after cluster correction at p < 0.05.
Figure 5.
Figure 5.
Lateralized functional connectivity. Connectivity is calculated as z-transformed dwPLI. a, Grand average time-frequency plots of contralateral minus ipsilateral connectivity between the three lateral posterior electrodes O1/2, PO3/4, and PO7/8 and the parietal Pz/POz electrodes. Black outline indicates a significant difference between contralateral versus ipsilateral connectivity in grand average after a permutation test with cluster correction at p < 0.05. b, Bars represent, per condition, the average contralateral (black) and ipsilateral (gray) connectivity between POz/Pz and O1/2, PO3/4, and PO7/8 within the time-frequency cluster/window highlighted in a. d, Scalp distributions, per condition (rows), of connectivity averaged over the significant time-frequency cluster depicted in a (first delay, first column) or averaged over a window of 0–900 ms by 8–14 Hz (second delay, second column). Topographical maps, Connectivity between each electrode and Pz/POz combined, for trials where the memory item was presented on the left minus those where it was presented on the right (full topographies), or for ipsilateral electrodes subtracted from contralateral electrodes and collapsed over hemispheres (half topographies). c, Grand average time-frequency plots of connectivity between left (O1, PO3, and PO7) and right (O2, PO4, and PO8) hemisphere. Black outline indicates significant connectivity after permutation test with cluster correction at p < 0.001. For the first delay, t = 0, t = 400, and t = 2200 indicate the memory display onset, start of first delay, and end of first delay, respectively. For the second delay, t = 0 and t = 1800 indicate the start and end of second delay, respectively. e, Bars represent average connectivity within the significant time-frequency cluster, per condition. Error bars indicate SEM for normalized data.
Figure 6.
Figure 6.
Nonlateralized posterior α power in second delay. a, Time series of α power per condition averaged over O1/2, PO3/4, and PO7/8 during the second delay, independent of lateralized memory item location. b, Time-frequency plot of condition difference (Current Only − Prospective Only) during the second delay. Black outline indicates significant condition difference at p < 0.05 cluster corrected. In the time-frequency plot, t = 0 and t = 1800 indicate the start and end of second delay, respectively.

References

    1. Awh E, Jonides J (2001) Overlapping mechansims of attention and spatial working memory. Trends Cogn Sci 5:119–126. 10.1016/S1364-6613(00)01593-X - DOI - PubMed
    1. Bressler SL, Tang W, Sylvester CM, Shulman GL, Corbetta M (2008) Top-down control of human visual cortex by frontal and parietal cortex in anticipatory visual spatial attention. J Neurosci 28:10056–10061. 10.1523/JNEUROSCI.1776-08.2008 - DOI - PMC - PubMed
    1. Bundesen C. (1990) A theory of visual attention. Psychol Rev 97:523–547. 10.1037/0033-295X.97.4.523 - DOI - PubMed
    1. Capotosto P, Babiloni C, Romani GL, Corbetta M (2009) Fronto-parietal cortex controls spatial attention through modulation of anticipatory alpha rhythms. J Neurosci 29:5863–5872. 10.1523/JNEUROSCI.0539-09.2009 - DOI - PMC - PubMed
    1. Carlisle NB, Woodman GF (2011) Automatic and strategic effects in the guidance of attention by working memory representations. Acta Psychol (Amst) 137:217–225. 10.1016/j.actpsy.2010.06.012 - DOI - PMC - PubMed

Publication types

LinkOut - more resources