. 2017 Jan 24;114(4):746-751.
doi: 10.1073/pnas.1611113114. Epub 2017 Jan 9.

Chronic innate immune activation of TBK1 suppresses mTORC1 activity and dysregulates cellular metabolism

Affiliations

Chronic innate immune activation of TBK1 suppresses mTORC1 activity and dysregulates cellular metabolism

Maroof Hasan et al. Proc Natl Acad Sci U S A. .

Abstract

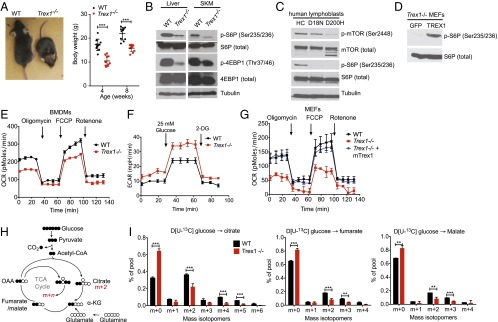
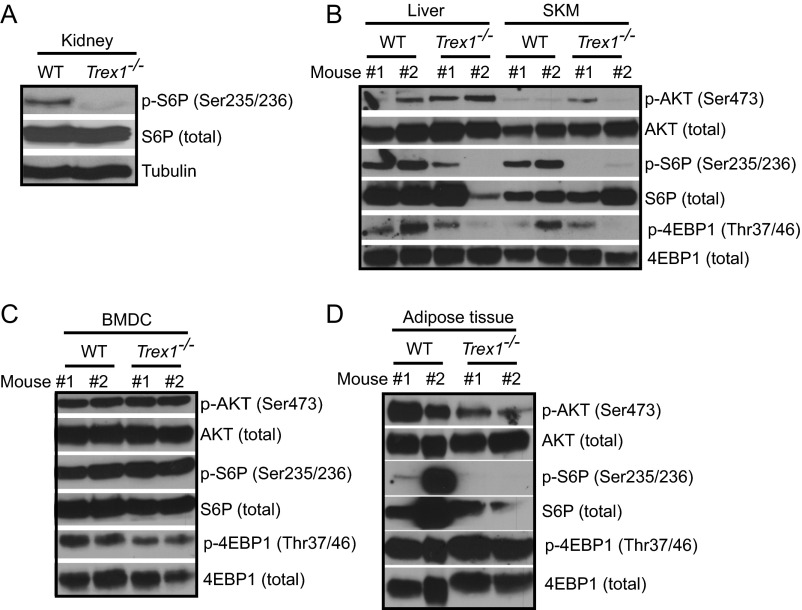
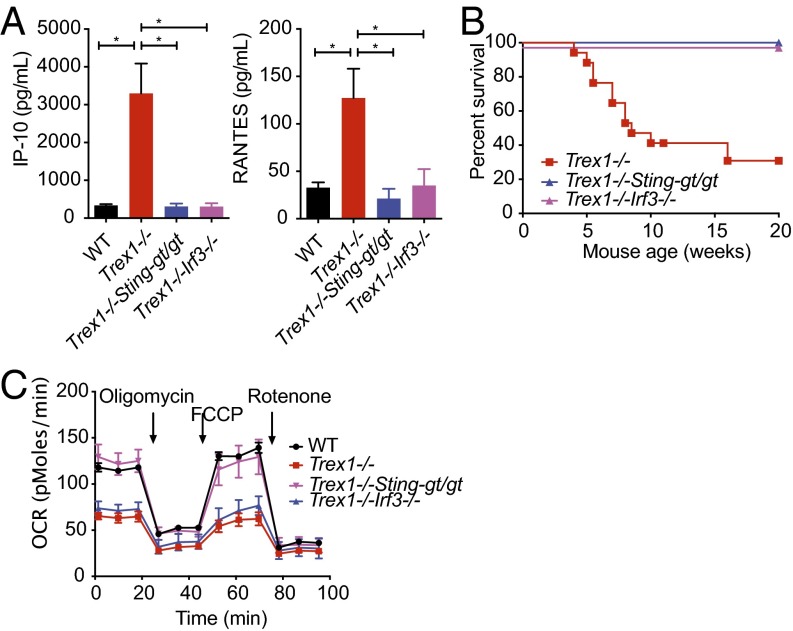
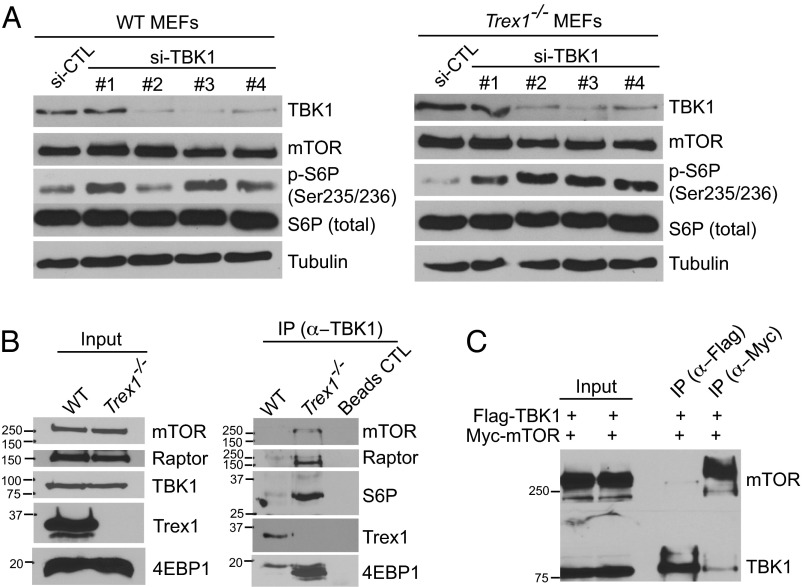
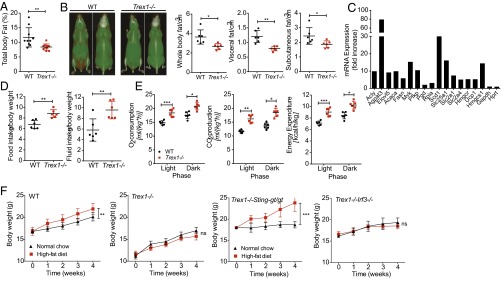
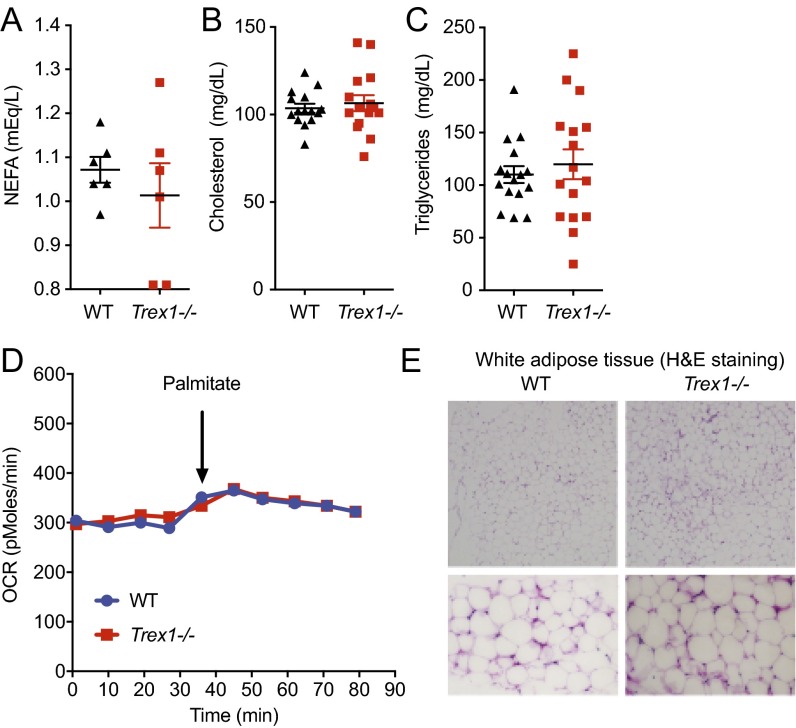
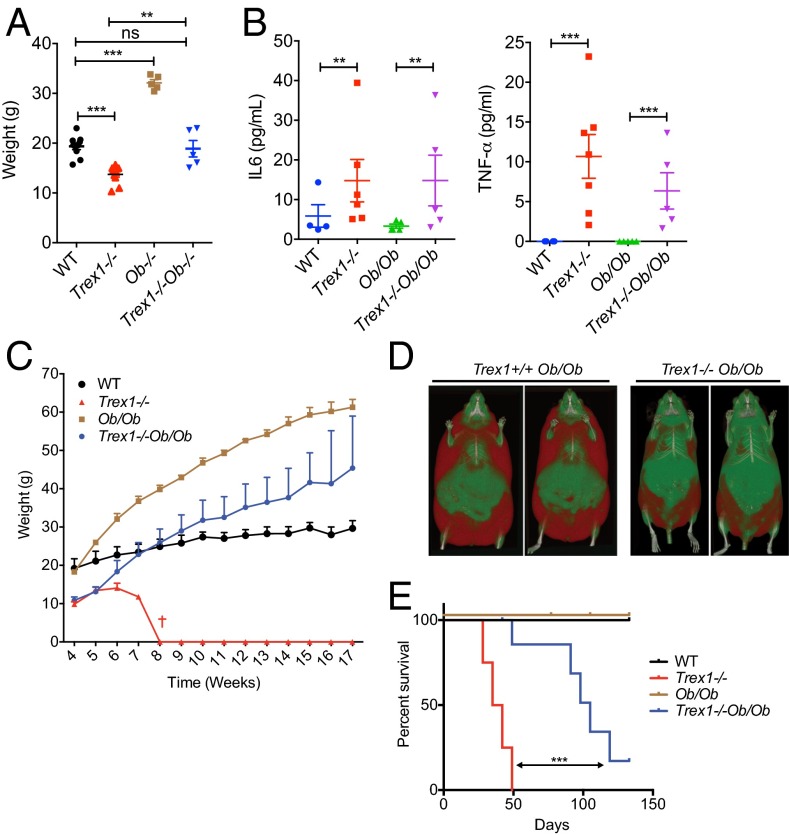
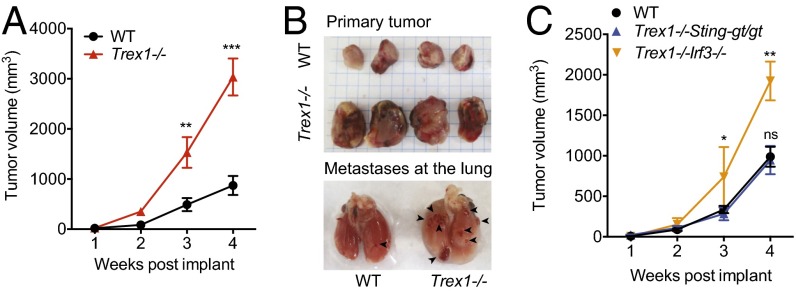
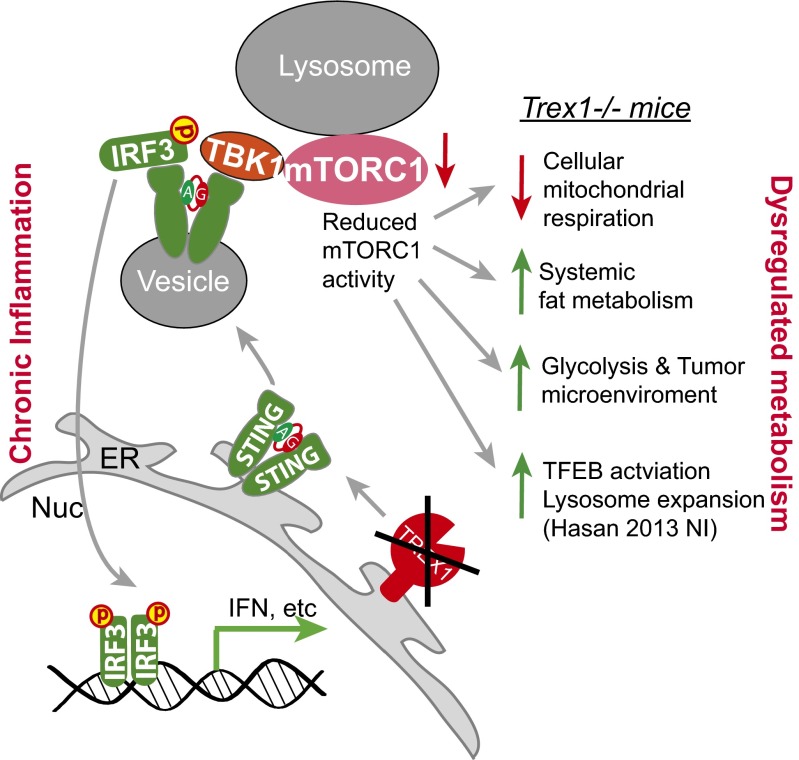
Three-prime repair exonuclease 1 knockout (Trex1-/-) mice suffer from systemic inflammation caused largely by chronic activation of the cyclic GMP-AMP synthase-stimulator of interferon genes-TANK-binding kinase-interferon regulatory factor 3 (cGAS-STING-TBK1-IRF3) signaling pathway. We showed previously that Trex1-deficient cells have reduced mammalian target of rapamycin complex 1 (mTORC1) activity, although the underlying mechanism is unclear. Here, we performed detailed metabolic analysis in Trex1-/- mice and cells that revealed both cellular and systemic metabolic defects, including reduced mitochondrial respiration and increased glycolysis, energy expenditure, and fat metabolism. We also genetically separated the inflammatory and metabolic phenotypes by showing that Sting deficiency rescued both inflammatory and metabolic phenotypes, whereas Irf3 deficiency only rescued inflammation on the Trex1-/- background, and many metabolic defects persist in Trex1-/-Irf3-/- cells and mice. We also showed that Leptin deficiency (ob/ob) increased lipogenesis and prolonged survival of Trex1-/- mice without dampening inflammation. Mechanistically, we identified TBK1 as a key regulator of mTORC1 activity in Trex1-/- cells. Together, our data demonstrate that chronic innate immune activation of TBK1 suppresses mTORC1 activity, leading to dysregulated cellular metabolism.

Keywords: TBK1; TREX1; innate immunity; mTORC1; metabolism.


Conflict of interest statement

The authors declare no conflict of interest.

Figures

Fig. 1.
Fig. 1.
Reduced mTORC1 activity and defective mitochondrial respiration in Trex1−/− cells and tissues. (A) Representative images of WT and Trex1−/− mice at the age of 6–8 wk. Body weight was measured at 8 wk (n = 10). (B) Immunoblot analysis of phosphorylated and total S6P and 4E-BP1 in WT and Trex1−/− mouse tissues. (C) Immunoblot analysis of phosphorylated and total mTOR and S6P in healthy control (HC) and TREX1-D18N and TREX1-D200H mutant patient lymphoblasts. (D) Immunoblot analysis of phosphorylated and total S6P in Trex1−/− MEFs reconstituted with GFP (control) or mouse TREX1. (EG) Real-time changes in the OCR and ECAR of WT or Trex1−/− BMDMs (E and F) or MEFs (G). OCR was assessed during subsequent sequential treatment with oligomycin (inhibitor of ATP synthase), FCCP (carbonyl cyanide 4-(trifluoromethoxy) phenylhydrazone), and rotenone (inhibitors of the electron-transport chain). ECAR was assessed during sequential treatment with 25 mM glucose and 2-deoxyglucose (2-DG). (H) Schematic representation of metabolism of [U-13C]glucose for experiments in G. (I) Mass isotopomer analysis of citrate, fumarate, and malate in cells cultured with [U-13C]glucose and unlabeled glutamine. Data are presented as the means ± SEM of quadruplets of two to three independent experiments. *P < 0.05; **P < 0.01; ***P < 0.001 (Student’s t test).
Fig. S1.
Fig. S1.
Reduced mTORC1 activity in Trex1−/− mouse tissues. Immunoblot analysis of phosphorylated and total S6P, 4E-BP1, and AKT in WT and Trex1−/− mouse kidney (A), liver and skeletal muscle (SKM) (B), BMDCs (C), and adipose tissues (D).
Fig. 2.
Fig. 2.
Cellular metabolic defect associated with Trex1−/− is STING-dependent but IRF3-independent. (A) Serum levels of indicated inflammatory cytokines in WT, Trex1−/−, Trex1−/−Stinggt/gt, and Trex1−/−Irf3−/− mice. (B) Survival curve of Trex1−/−, Trex1−/−Stinggt/gt, and Trex1−/−Irf3−/− mice. (C) Real-time changes in the OCR of WT, Trex1−/−, Trex1−/−Stinggt/gt, and Trex1−/−Irf3−/− BMDMs. Data are representative of at least two independent experiments.
Fig. 3.
Fig. 3.
TBK1 is recruited to the mTORC1 complex and inhibits mTORC1 complex activity in Trex1−/− cells. (A) Immunoblot analyses of mTORC1 activity in WT or Trex1−/− MEFs after control or TBK1 knocked down by siRNA. (B) Immunoblot analyses of TBK1–mTORC1 interaction in WT or Trex1−/− BMDMs. IP was performed with anti-TBK1 antibody and subsequently blotted for indicated proteins. (C) Immunoblot analyses of TBK1–mTORC1 interactions by transient transfection of Flag-TBK1 and Myc-mTOR plasmids and IP with indicated antibodies (Upper) in 293T cells. Both Flag-TBK1 and Myc-mTORC1 were expressed in both conditions, but Flag IP was performed in one sample and blot for Myc (upper strip of membrane), and Myc was performed in another sample and blot for Flag (lower strip of membrane).
Fig. 4.
Fig. 4.
Trex1−/− mice exhibit a hypermetabolic state with reduced adiposity and increased energy expenditure. (A) Percentage of total body fat in WT and Trex1−/− mice (n = 10). (B) High-resolution micro-CT scan images of WT and Trex1−/− mice (front and back view of the same mouse, red indicates fat mass). Representative images are shown on the left. Quantitation of whole-body, visceral, and subcutaneous fat volume is shown on the right (n = 6). (C) qRT-PCR analysis of selected genes involved in lipid metabolic pathways. (D) Food and fluid intake in WT and Trex1−/− mice over a period of 5 d (n = 6). (E) Oxygen consumption, CO2 production, and energy expenditure in WT and Trex1−/− mice (n = 6). (F) Body weights of WT or Trex1−/−, Trex1−/−Stinggt/gt, and Trex1−/−Irf3−/− mice on normal chow or HFD over a period of 4 wk (n = 9). Data are presented as the means ± SEM *P < 0.05; **P < 0.01; ***P < 0.001 (Student’s t test).
Fig. S2.
Fig. S2.
Serum lipids and white adipose tissue are not affected by Trex1−/−. (AC) WT and Trex1−/− mouse serum NEFA, triglyceride, and cholesterol measurements. No statistically significant difference was observed. (D) Seahorse measurement of fatty acid oxidation (FAO) in WT and Trex1−/− cells using palmitate–BSA FAO substrate. (E) H&E staining of white adipose tissue isolated from WT and Trex1−/− mice. The lower images are close-up views.
Fig. 5.
Fig. 5.
Leptin deficiency (Ob/Ob) increases lipogenesis and survival of Trex1−/− mice without dampening inflammation. (A) Body weights of mice of indicated genotypes on normal chow diet for 6 wk (n = 5–10). (B) Serum levels of indicated inflammatory cytokines. (C) Body weights of mice of indicated genotypes on normal chow diet for a period 17 wk (n = 5–10). (D) High-resolution micro-CT scan images of WT and Trex1−/− mice on Ob/Ob background (front view of two separate mice, red indicates fat mass). (E) Survival curve of mice of indicated genotypes (n = 5–10). Data are presented as the means ± SEM. *P < 0.05; **P < 0.01; ***P < 0.001. (A and B, Student’s t test; E, log-rank test.)
Fig. 6.
Fig. 6.
Trex1−/− mice support accelerated growth of implanted breast cancer cells. (A) E0771 breast tumor growth in WT and Trex1−/− mice; 5 × 10⁵ E0771 cells were injected into mammary pads of female WT and Trex1−/− mice. Tumor sizes were recorded weekly (n = 9). (B) Representative images of primary and metastatic tumor at week 4 from WT or Trex1−/− mice. (C) E0771 breast tumor growth in WT and Trex1−/−Stinggt/gt and Trex1−/−Irf3−/− mice. E0771 cells were injected as in A. Data are presented as the means ± SEM. *P < 0.05; **P < 0.01; ***P < 0.001; ns, not significant (Student’s t test).
Fig. 7.
Fig. 7.
A model. Trex1−/− leads to chronic activation of the STING–TBK1–IRF3 signaling pathway, leading to inflammation through IRF3 and mTORC1 inhibition by TBK1. Reduced mTORC1 activity causes metabolic dysregulation, including reduced mitochondrial respiration and increased glycolysis and fat metabolism.

References

    1. Hasan M, et al. Trex1 regulates lysosomal biogenesis and interferon-independent activation of antiviral genes. Nat Immunol. 2013;14(1):61–71. - PMC - PubMed
    1. Hasan M, et al. Cytosolic nuclease TREX1 regulates oligosaccharyltransferase activity independent of nuclease activity to suppress immune activation. Immunity. 2015;43(3):463–474. - PMC - PubMed
    1. Stetson DB, Ko JS, Heidmann T, Medzhitov R. Trex1 prevents cell-intrinsic initiation of autoimmunity. Cell. 2008;134(4):587–598. - PMC - PubMed
    1. Crow YJ, Rehwinkel J. Aicardi-Goutieres syndrome and related phenotypes: linking nucleic acid metabolism with autoimmunity. Hum Mol Genet. 2009;18(R2):R130–R136. - PMC - PubMed
    1. Gall A, et al. Autoimmunity initiates in nonhematopoietic cells and progresses via lymphocytes in an interferon-dependent autoimmune disease. Immunity. 2012;36(1):120–131. - PMC - PubMed

Publication types

MeSH terms

Substances