. 2017 Jan 24;114(4):E457-E465.
doi: 10.1073/pnas.1606380114. Epub 2017 Jan 9.

Content analysis of 150 years of British periodicals

Collaborators, Affiliations

Content analysis of 150 years of British periodicals

Thomas Lansdall-Welfare et al. Proc Natl Acad Sci U S A. .

Abstract

Previous studies have shown that it is possible to detect macroscopic patterns of cultural change over periods of centuries by analyzing large textual time series, specifically digitized books. This method promises to empower scholars with a quantitative and data-driven tool to study culture and society, but its power has been limited by the use of data from books and simple analytics based essentially on word counts. This study addresses these problems by assembling a vast corpus of regional newspapers from the United Kingdom, incorporating very fine-grained geographical and temporal information that is not available for books. The corpus spans 150 years and is formed by millions of articles, representing 14% of all British regional outlets of the period. Simple content analysis of this corpus allowed us to detect specific events, like wars, epidemics, coronations, or conclaves, with high accuracy, whereas the use of more refined techniques from artificial intelligence enabled us to move beyond counting words by detecting references to named entities. These techniques allowed us to observe both a systematic underrepresentation and a steady increase of women in the news during the 20th century and the change of geographic focus for various concepts. We also estimate the dates when electricity overtook steam and trains overtook horses as a means of transportation, both around the year 1900, along with observing other cultural transitions. We believe that these data-driven approaches can complement the traditional method of close reading in detecting trends of continuity and change in historical corpora.

Keywords: Culturomics; artificial intelligence; computational history; data science; digital humanities.


Conflict of interest statement

F.N.T. is a team within the company FindMyPast. Its main role has been to provide part of the data and relative text.

Figures
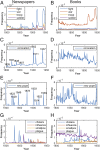
Fig. 1.
Fig. 1.
Comparison between (A, C, E, and G) our corpus of British periodicals and (B, D, F, and H) the Google books corpus (1) using n-gram trends identifying (A and B) major wars, (C and D) coronations, (E and F) conclaves, and (G and H) epidemics between 1800 and 1950 in the United Kingdom. Events are clearly identifiable in the periodical corpus, whereas it is more difficult to distinguish exact years of events in the books corpus.
Fig. 2.
Fig. 2.
Values, beliefs, and United Kingdom politics. n-Gram trends showing (A and B) a decline in Victorian values as put forward by Gibbs and Cohen (3), (C) that Gladstone was much more newsworthy than Disraeli, (D) that liberals are more mentioned than conservatives until the 1930s, and (E and F) that reference to British identity takes off in the 20th century.
Fig. 3.
Fig. 3.
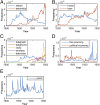
Technology and economy. n-Gram trends showing (A) the steady decline of steam and the rise of electricity, (B) the waning popularity of horses and the increase in trains, (C) the rate of uptake for different communication technologies, (D) “the economy” as a concept beginning in late Victorian times after a decline in “political economy,” and (E) that the four largest peaks for “panic” correspond with negative market movements linked to banking crises in 1826, 1847, 1857, and 1866.
Fig. 4.
Fig. 4.
Social change and popular culture. n-Gram trends showing that (A) “unrest” corresponds with well-known periods of social tension, whereas “revolt” corresponds with tension in British colonies; (B) the suffragette movement falls within a delimited time interval; (C) “slavery” includes the movement for abolitionism and the American Civil War, whereas “anarchist” corresponds to the heyday of concern over anarchist direct action before the rise of fascism and bolshevism; (D) the gender gap in mentions of men and women is closing, with women making advances during the two wars; (E) the gender gap is also closing when measured using the pronouns he and she; (F) actors, singers, and dancers begin to increase in the 1890s, rising significantly thereafter, whereas references to politicians, by contrast, gradually decline from the early 20th century; and (G) football is more prominent than cricket from 1909 on.
Fig. 5.
Fig. 5.
People in history. (A) Replicating the study (1) on famous personalities by occupation using all extracted entities associated with a Wikipedia entry, we found that politicians and writers are most likely to achieve notoriety within their lifetimes, whereas scientists and mathematicians are less likely to achieve fame but decline less sharply. (B) We computed the probability that a given reference to a person is to a male or a female person. We find that, although males are more present than females during the entire period under investigation, there is a slow but steady increase of the presence of women after 1900, although it is difficult to attribute this to a single factor at the time.
Fig. 6.
Fig. 6.
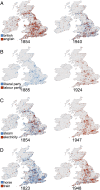
Changes in geography over time. Maps of the United Kingdom showing the changes in geographical focus of locations extracted from articles containing the terms (A) British and English, (B) Liberal Party and Labour Party, (C) steam and electricity, and (D) horse and train for the years in which each concept received its peak attention.

References

    1. Michel JB, et al. Quantitative analysis of culture using millions of digitized books. Science. 2011;331(6014):176–182. - PMC - PubMed
    1. Reddy R, StClair G. 2001 The Million Book Digital Library Project. (Carnegie Mellon University, Piittsburgh). Available at www.rr.cs.cmu.edu/mbdl.htm. Accessed December 19, 2016.
    1. Gibbs FW, Cohen DJ. A conversation with data: Prospecting Victorian words and ideas. Vic Stud. 2011;54(1):69–77.
    1. Mauch M, MacCallum RM, Levy M, Leroi AM. The evolution of popular music: USA 1960–2010. R Soc Open Sci. 2015;2(5):150081. - PMC - PubMed
    1. Leetaru K. Culturomics 2.0: Forecasting large-scale human behavior using global news media tone in time and space. First Monday. 2011;16(9)

Publication types

LinkOut - more resources