. 2017 Jan 24;114(4):E600-E609.
doi: 10.1073/pnas.1609000114. Epub 2017 Jan 9.

Task-specific reorganization of the auditory cortex in deaf humans

Affiliations

Task-specific reorganization of the auditory cortex in deaf humans

Łukasz Bola et al. Proc Natl Acad Sci U S A. .

Abstract

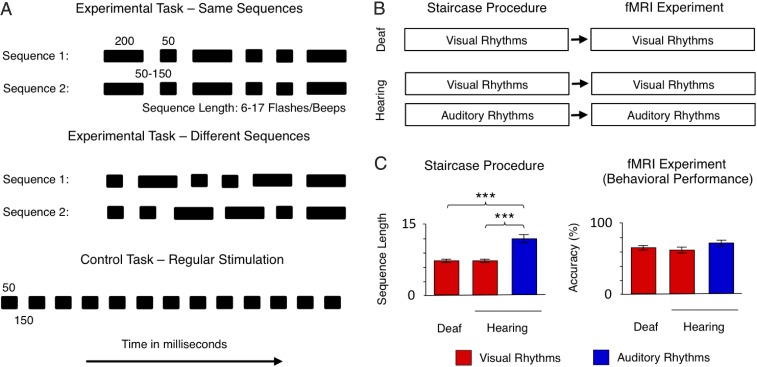
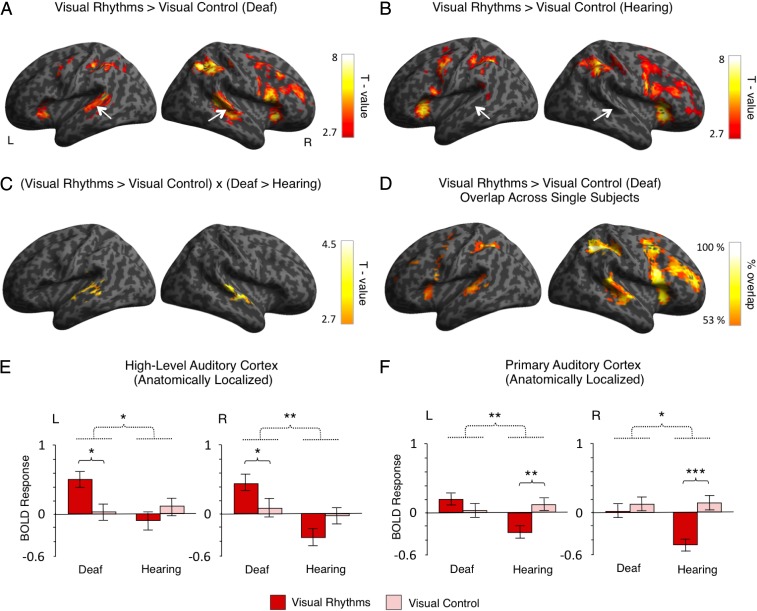
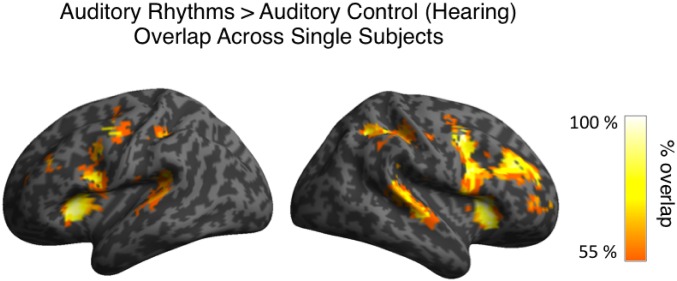
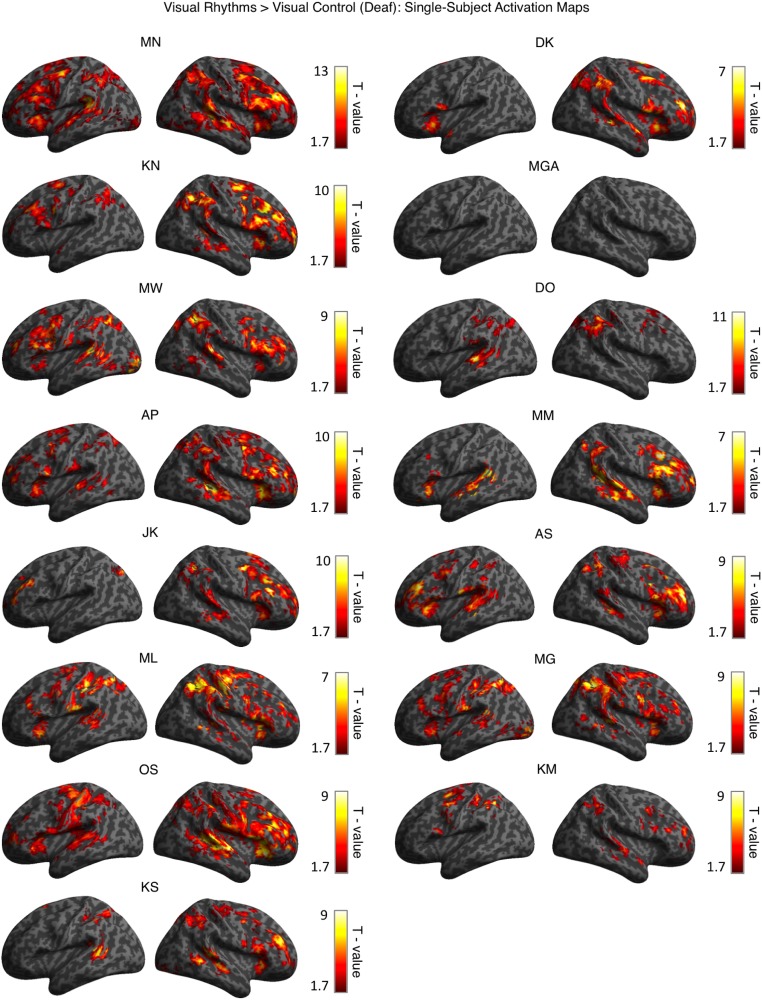
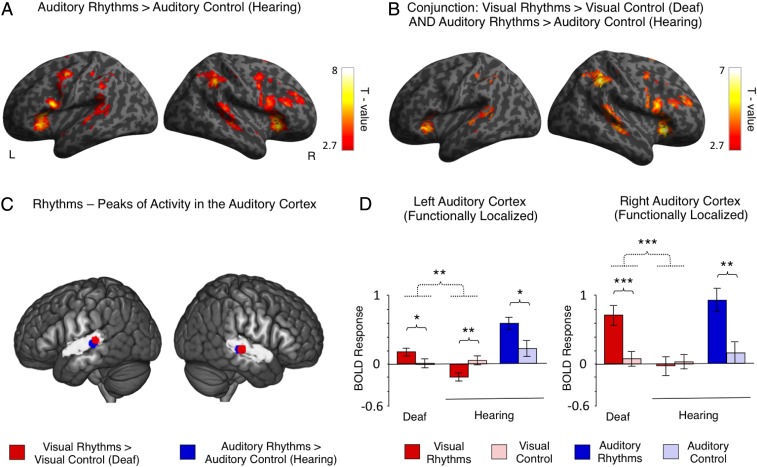
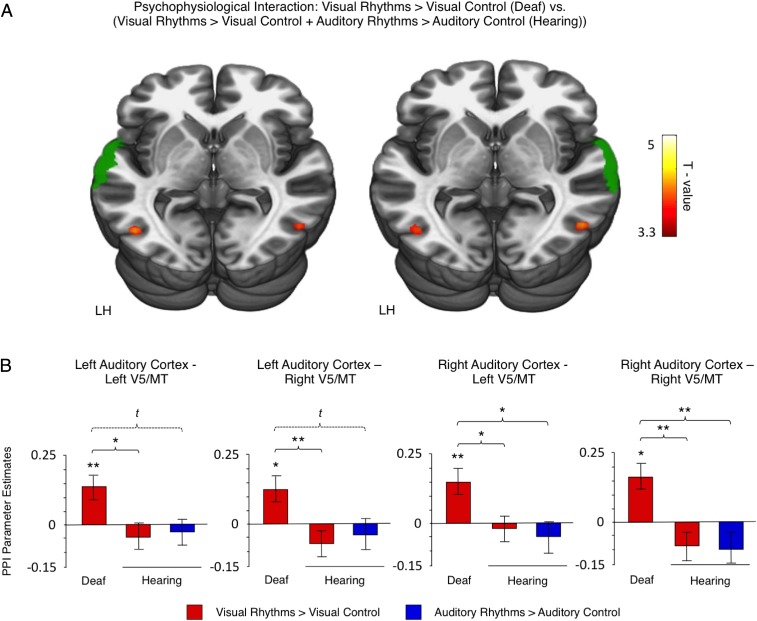
The principles that guide large-scale cortical reorganization remain unclear. In the blind, several visual regions preserve their task specificity; ventral visual areas, for example, become engaged in auditory and tactile object-recognition tasks. It remains open whether task-specific reorganization is unique to the visual cortex or, alternatively, whether this kind of plasticity is a general principle applying to other cortical areas. Auditory areas can become recruited for visual and tactile input in the deaf. Although nonhuman data suggest that this reorganization might be task specific, human evidence has been lacking. Here we enrolled 15 deaf and 15 hearing adults into an functional MRI experiment during which they discriminated between temporally complex sequences of stimuli (rhythms). Both deaf and hearing subjects performed the task visually, in the central visual field. In addition, hearing subjects performed the same task in the auditory modality. We found that the visual task robustly activated the auditory cortex in deaf subjects, peaking in the posterior-lateral part of high-level auditory areas. This activation pattern was strikingly similar to the pattern found in hearing subjects performing the auditory version of the task. Although performing the visual task in deaf subjects induced an increase in functional connectivity between the auditory cortex and the dorsal visual cortex, no such effect was found in hearing subjects. We conclude that in deaf humans the high-level auditory cortex switches its input modality from sound to vision but preserves its task-specific activation pattern independent of input modality. Task-specific reorganization thus might be a general principle that guides cortical plasticity in the brain.

Keywords: auditory cortex; cross-modal plasticity; fMRI; perception; sensory deprivation.


Conflict of interest statement

The authors declare no conflict of interest.

Figures

Fig. 1.
Fig. 1.
Experimental design and behavioral results. (A) The experimental task and the control task performed in the fMRI. Subjects were presented with pairs of sequences composed of flashes/beeps of short (50-ms) and long (200-ms) duration separated by 50- to 150-ms blank intervals. The sequences presented in each pair either were identical or the second sequence was a permutation of the first. The subjects were asked to judge whether two sequences in the pair were the same or different. The difficulty of the experimental task (i.e., the number of flashes/beeps presented in each sequence and the pace of presentation) was adjusted individually, before the fMRI experiment, using an adaptive staircase procedure. In the control task, the same flashes/beeps were presented at a constant pace (50-ms stimuli separated by 150-ms blank intervals), and subjects were asked to watch/listen to them passively. (B) Outline of the study. Deaf and hearing subjects participated in the study. Both groups performed the tasks visually, in the central visual field. Hearing subjects also performed the tasks in the auditory modality. Before the fMRI experiment, an adaptive staircase procedure was applied. (C) Behavioral results. (Left) Output of the adaptive staircase procedure (average length of sequences to be presented in the experimental task in the fMRI) for both subject groups and sensory modalities. (Right) Performance in the fMRI (the accuracy of the same/different decision in the experimental task). Thresholds: ***P < 0.001. Error bars represent SEM.
Fig. 2.
Fig. 2.
Visual rhythms presented in the central visual field activated the auditory cortex in deaf subjects. (A and B) Activations induced by visual rhythms relative to regular visual stimulation in deaf subjects (A) and hearing subjects (B). The auditory cortex is indicated by white arrows. (C) Interaction between the task and the subject’s group. The only significant effect of this analysis was found in the auditory cortex, bilaterally. (D) Overlap in single-subject activations for visual rhythms relative to regular visual stimulation across all deaf subjects. (E and F) The results of independent ROI analyses. ROIs were defined in the high-level auditory cortex (E) and the primary auditory cortex (F) based on an anatomical atlas. The analysis confirmed that visual rhythms enhanced activity in the high-level auditory cortex of deaf subjects, whereas no effect was found in the hearing subjects. Significant interaction between the task and the group also was found in the primary auditory cortex. However, this effect was driven mainly by significant deactivation of this region for visual rhythms in hearing subjects. Thresholds: (AC) P < 0.005 voxelwise and P < 0.05 clusterwise. (D) Each single-subject activation map was assigned a threshold of P < 0.05 voxelwise and P < 0.05 clusterwise. Only overlaps that are equal to or greater than 53% of all deaf subjects are presented. (E and F) *P < 0.05; **P < 0.01; ***P < 0.001. Dashed lines denote interactions. Error bars represent SEM.
Fig. S1.
Fig. S1.
Overlap in single-subject activations for auditory rhythms relative to auditory control across all hearing subjects. Each single-subject activation map was assigned a threshold of P < 0.05 voxelwise and P < 0.05 clusterwise. Only overlaps equal to or greater than 55% of all hearing subjects are presented.
Fig. S2.
Fig. S2.
Single-subject activation maps for visual rhythms vs. visual control contrast for all deaf subjects. Each map was assigned a threshold of P < 0.05 voxelwise and P < 0.05 clusterwise. The order of subjects corresponds to Table S1.
Fig. 3.
Fig. 3.
The auditory cortex processes rhythm independently of sensory modality. (A) Activations induced by auditory rhythms relative to regular auditory stimulation in hearing subjects. (B) Brain regions that were activated both by visual rhythms relative to regular visual stimulation in deaf subjects and auditory rhythms relative to regular auditory stimulation in hearing subjects (conjunction analysis). (C) Peaks of activation for visual and auditory rhythms in the auditory cortex. Peaks for visual rhythms relative to regular visual stimulation in deaf subjects are illustrated in red. Peaks for auditory rhythms relative to regular auditory stimulation in hearing subjects are depicted in blue. The high-level auditory cortex is illustrated in gray, based on an anatomical atlas. The peaks are visualized as 6-mm spheres. Note the consistency of localization of peaks, even though deaf and hearing subjects performed the task in different sensory modalities. (D) The results of an ROI analysis in which activations in the auditory cortex induced by visual rhythms and auditory rhythms were used as independent localizers for each other. ROIs for comparisons between visual tasks were defined based on activation in the auditory cortex induced by auditory rhythms relative to regular auditory stimulation in hearing subjects. ROIs for comparison between auditory tasks were defined based on visual rhythms vs. regular visual stimulation contrast in deaf subjects. Dotted lines denote interactions. Error bars represent SEM. Thresholds: (A and B) P < 0.005 voxelwise and P < 0.05 clusterwise. (D) *P < 0.05; **P < 0.01; ***P < 0.001.
Fig. 4.
Fig. 4.
Functional connectivity between the auditory cortex and the V5/MT cortex was strengthened when deaf subjects performed visual rhythm discrimination. (A) Visual regions showing increased functional coupling with the high-level auditory cortex during visual rhythm processing relative to visual control in deaf subjects vs. no effect in hearing subjects (PPI analysis, between-group comparison). The analyses for the left and the right auditory cortex were performed separately. The seed regions (depicted in green) were defined based on an anatomical atlas. LH, left hemisphere. (B) The results of an ROI analysis, based on V5/MT anatomical masks. Thresholds: (A) P < 0.001 voxelwise and P < 0.05 clusterwise. The analysis was masked with the visual cortex anatomical mask. (B) t, trend level, P < 0.1; *P < 0.05; **P < 0.01; ***P < 0.001. Error bars represent SEM.

Comment in

References

    1. Hyvärinen J, Carlson S, Hyvärinen L. Early visual deprivation alters modality of neuronal responses in area 19 of monkey cortex. Neurosci Lett. 1981;26(3):239–243. - PubMed
    1. Rauschecker JP. Compensatory plasticity and sensory substitution in the cerebral cortex. Trends Neurosci. 1995;18(1):36–43. - PubMed
    1. Sur M, Garraghty PE, Roe AW. Experimentally induced visual projections into auditory thalamus and cortex. Science. 1988;242(4884):1437–1441. - PubMed
    1. Merabet LB, Pascual-Leone A. Neural reorganization following sensory loss: The opportunity of change. Nat Rev Neurosci. 2010;11(1):44–52. - PMC - PubMed
    1. Siuda-Krzywicka K, et al. Massive cortical reorganization in sighted Braille readers. eLife. 2016;5:e10762. - PMC - PubMed

Publication types

LinkOut - more resources