. 2017 Jan 24;114(4):E524-E533.
doi: 10.1073/pnas.1614336114. Epub 2017 Jan 9.

Dual role of ALCAM in neuroinflammation and blood-brain barrier homeostasis

Affiliations

Dual role of ALCAM in neuroinflammation and blood-brain barrier homeostasis

Marc-André Lécuyer et al. Proc Natl Acad Sci U S A. .

Abstract

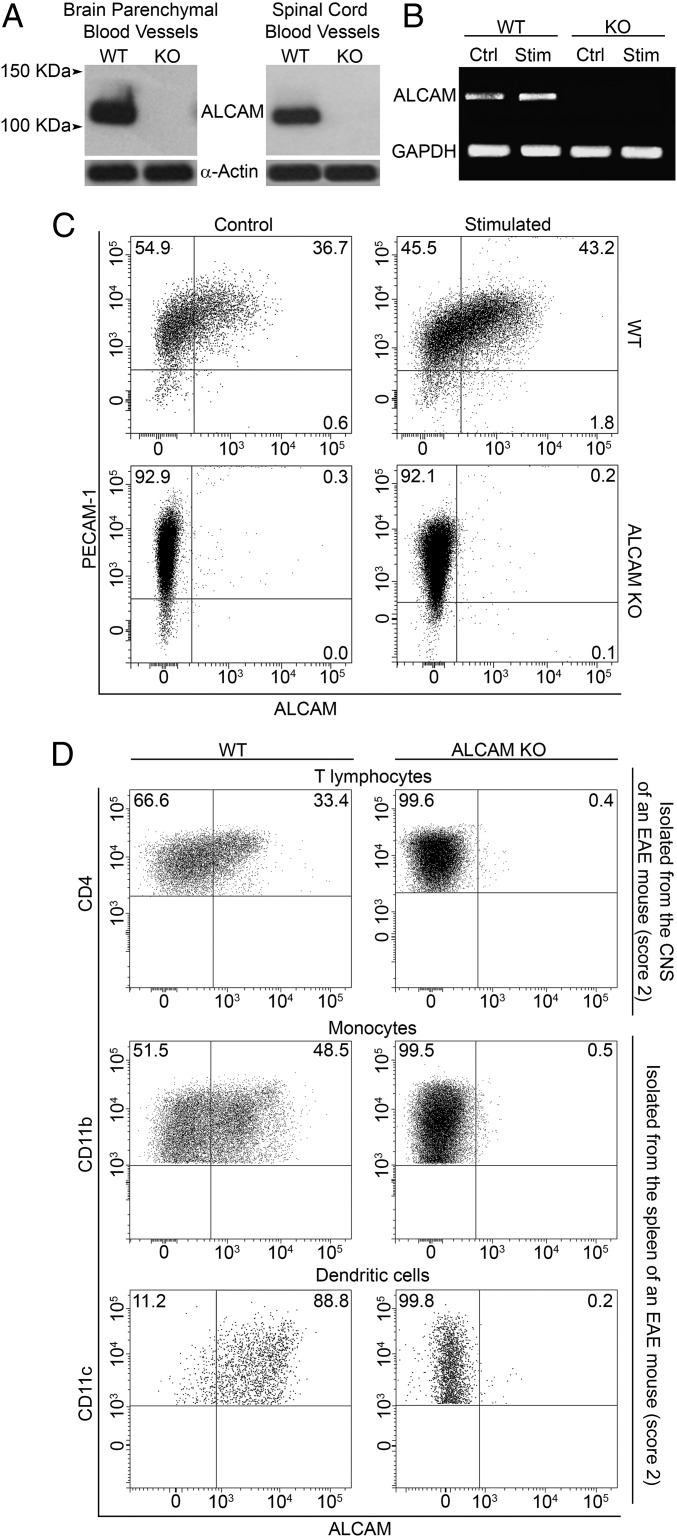
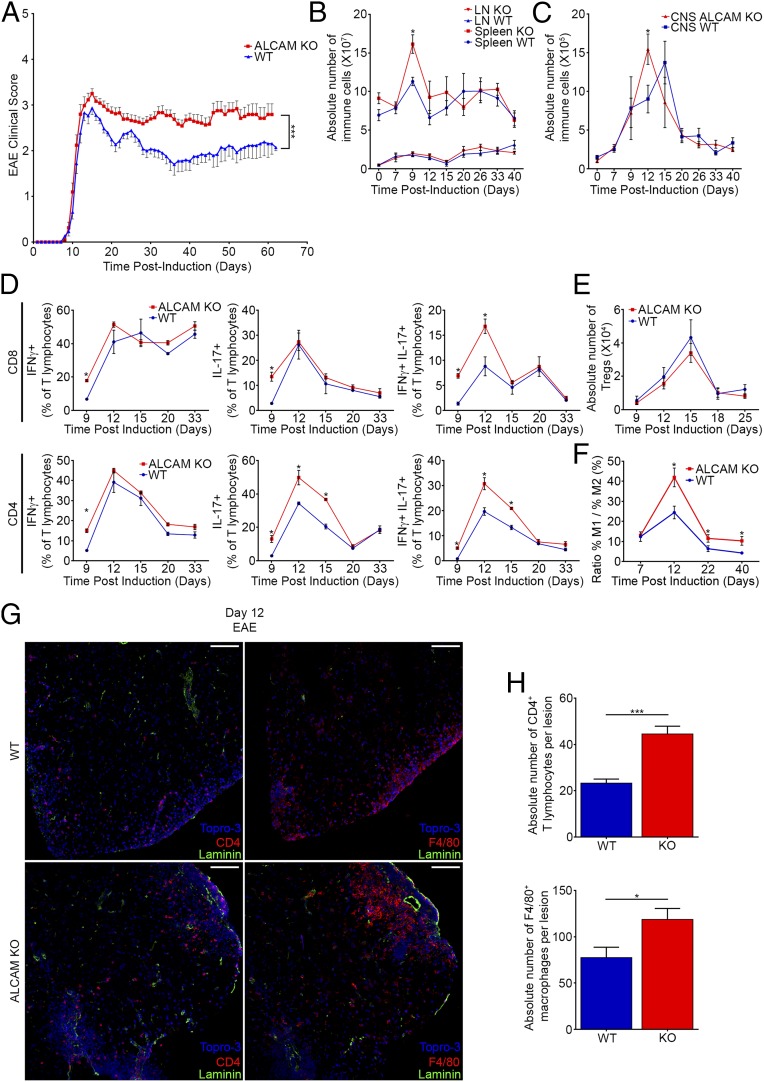
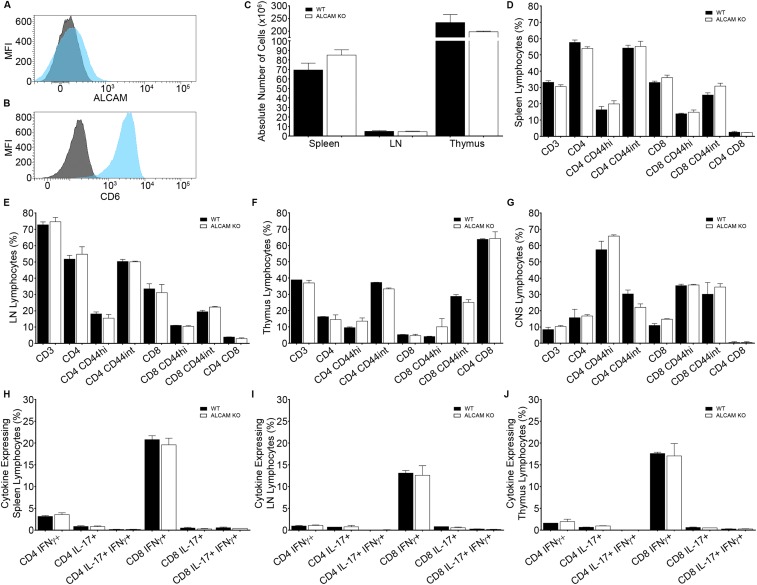
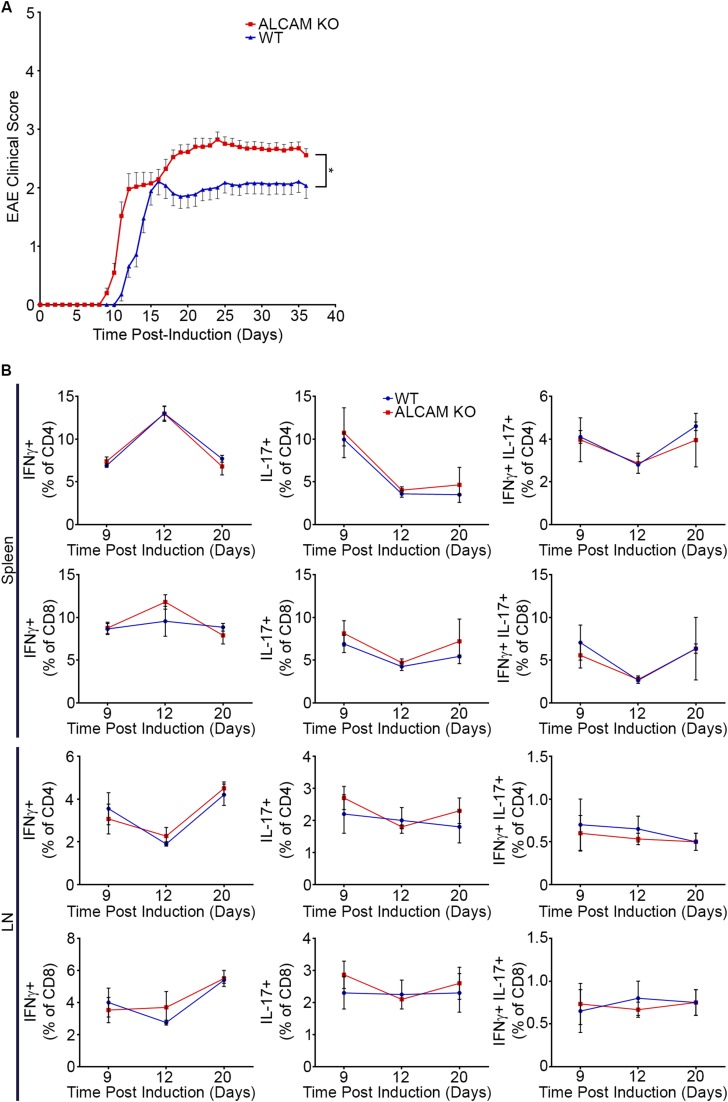
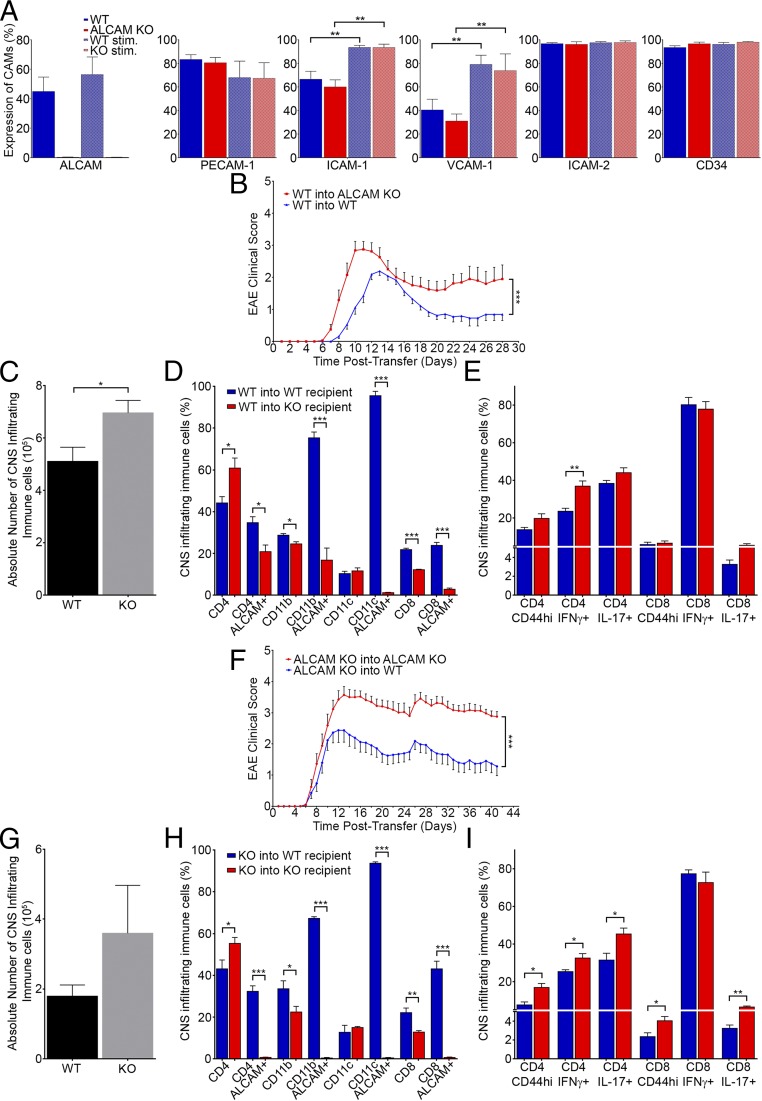
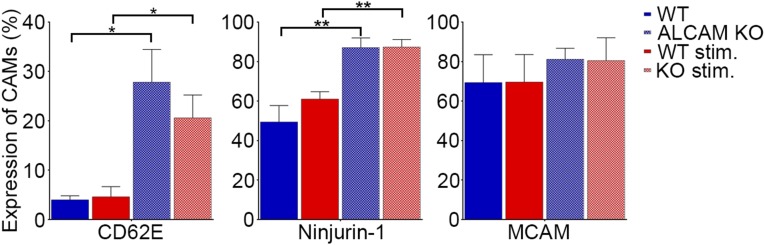
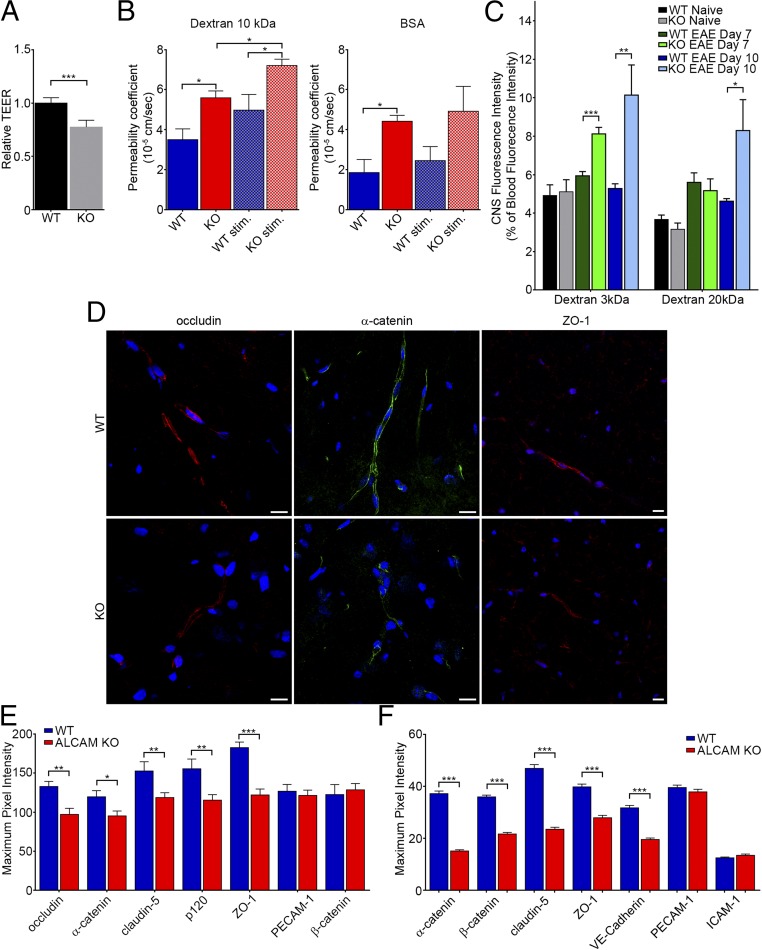
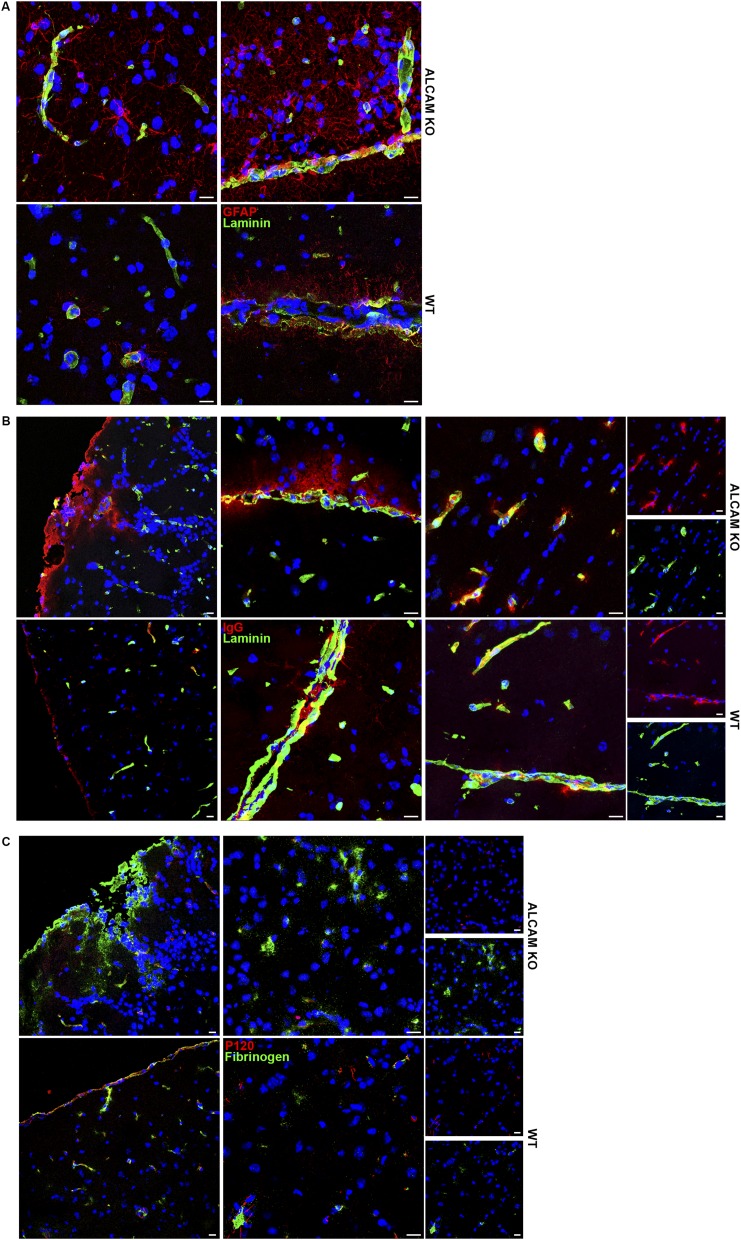
Activated leukocyte cell adhesion molecule (ALCAM) is a cell adhesion molecule found on blood-brain barrier endothelial cells (BBB-ECs) that was previously shown to be involved in leukocyte transmigration across the endothelium. In the present study, we found that ALCAM knockout (KO) mice developed a more severe myelin oligodendrocyte glycoprotein (MOG)35-55-induced experimental autoimmune encephalomyelitis (EAE). The exacerbated disease was associated with a significant increase in the number of CNS-infiltrating proinflammatory leukocytes compared with WT controls. Passive EAE transfer experiments suggested that the pathophysiology observed in active EAE was linked to the absence of ALCAM on BBB-ECs. In addition, phenotypic characterization of unimmunized ALCAM KO mice revealed a reduced expression of BBB junctional proteins. Further in vivo, in vitro, and molecular analysis confirmed that ALCAM is associated with tight junction molecule assembly at the BBB, explaining the increased permeability of CNS blood vessels in ALCAM KO animals. Collectively, our data point to a biologically important function of ALCAM in maintaining BBB integrity.

Keywords: ALCAM; EAE; blood–brain barrier; multiple sclerosis; tight junctions.


Conflict of interest statement

The authors declare no conflict of interest.

Figures

Fig. 1.
Fig. 1.
Expression of ALCAM at the BBB and on immune cells. (A) Expression of ALCAM in freshly isolated blood vessels from the brain and spinal cord of WT and ALCAM KO mice, by Western blot (actin, control protein). Data are representative of n = 5 independent experiments. (B) RT-PCR analysis of ALCAM mRNA obtained from primary culture of mouse BBB-ECs (MBECs) from WT and ALCAM KO mice either resting (Ctrl) or treated with TNF and IFNγ (Stim, Stimulated). Data are representative of n = 2 independent experiments. (C) Expression of ALCAM and PECAM-1 on primary cultures of MBECs obtained from WT and ALCAM KO mice as assessed by flow cytometry. Data are representative of n = 5 independent experiments. (D) Expression of ALCAM on ex vivo CD4+ T lymphocytes isolated from the CNS as well as CD11b+ monocytes/macrophages and CD11b+CD11c+ dendritic cells isolated from splenocytes of ALCAM KO mice or their WT littermates during the early symptomatic phase of active EAE. Data are representative of n = 3 independent experiments.
Fig. 2.
Fig. 2.
ALCAM KO mice develop a more severe active EAE. (A) Mean cumulative clinical EAE score from MOG35–55–immunized C57BL/6 WT and ALCAM KO mice. Data shown are the mean ± SEM of 40 mice per group and representative of n = 12 independent experiments. Absolute numbers of immune cells isolated from the spleens and LNs (B) or from the CNS (C) of WT and ALCAM KO mice at different dpi of EAE. Data shown are the mean ± SEM of 3–12 animals per time point and representative of n = 8 independent experiments. (D) Percentage of IFNγ-, IL-17–, or IFNγ and IL-17–expressing CD4+ and CD8+ T lymphocytes isolated from the CNS of WT and ALCAM KO mice at different dpi of EAE, as assessed by flow cytometry. Data shown are the mean ± SEM of 3–5 animals per time point and representative of n = 5 independent experiments. (E) Absolute numbers of CD4+CD25+FOXP3+ regulatory T lymphocytes infiltrating the CNS of ALCAM KO and WT mice at different dpi of EAE, as assessed by flow cytometry. Data shown are the mean ± SEM of 3–6 animals per time point and representative of n = 3 independent experiments. (F) Prevalence of M1 monocytes/macrophages relative to M2 subtype isolated from the CNS of WT and ALCAM KO mice at different dpi of EAE, as assessed by their expression of CD11b, CD43, CD206, Ly6C, IL-10, and IL-12 by flow cytometry. Data shown are the mean ± SEM of 4–10 animals per time point pooled from three independent experiments. (G) Immunofluorescent staining of laminin (green), TOPRO-3 (nuclei, blue), and CD4 or F4/80 (red) in spinal cord sections of ALCAM KO and WT mice at day 12 postinduction of EAE. (Scale bar, 100 µm.) Images shown are representative of nine sections per animal and representative of n = 4 animals per group. (H) Absolute numbers of CD4+ T lymphocytes and F4/80+ macrophages observed per lesion. n = 10–15 lesions assessed from three animals per group. *P ≤ 0.05, ***P ≤ 0.001.
Fig. S1.
Fig. S1.
Expression of (A) ALCAM and (B) CD6 on resting memory CD4+ T lymphocytes isolated from naïve WT splenocytes, as assessed by flow cytometry. Mean fluorescence intensity of ALCAM (blue) or CD6 (blue) and their respective isotype control (gray). (C) Absolute number of leukocytes in the spleen, LN, and thymus of naïve ALCAM KO mice and their WT littermates. Percentage of lymphocytes isolated from the spleen (D), the LNs (E), the thymus (F), and the CNS (G) of naïve ALCAM KO and WT mice positive for the extracellular marker CD3, CD4, CD8, and CD44, as assessed by flow cytometry. Percentages of CD4+ and CD8+ cells are gated on CD3+ T lymphocytes. Percentages of CD44+ cells are gated on CD4+ or CD8+ T lymphocytes. Data shown are the mean ± SEM of 3–9 animals per time point. Percentage of CD4+ or CD8+ T lymphocytes isolated from the spleen (H), the LNs (I), and the thymus (J) of naïve ALCAM KO and WT mice expressing the cytokines IFNγ and/or IL-17, as assessed by flow cytometry. Data shown are the mean ± SEM of 3–9 animals per time point.
Fig. S2.
Fig. S2.
(A) Mean cumulative clinical EAE score from recombinant human MOG-immunized C57BL/6 WT and ALCAM KO mice. Data shown are the mean ± SEM of 42 WT and 45 ALCAM KO mice per group and are the cumulative clinical scores obtained in n = 3 independent experiments. AUC: WT, 54.88 ± 2.29; ALCAM KO, 64.07 ± 2.59. *P ≤ 0.05. (B) Percentage of CD4+ or CD8+ T lymphocytes isolated from the spleen and the LNs of ALCAM KO and WT mice expressing IFNγ and/or IL-17 at different time points post–MOG35–55 induction of active EAE. Data shown are the mean ± SEM of three animals per time point.
Fig. 3.
Fig. 3.
The absence of ALCAM on BBB-ECs increases EAE disease severity. (A) Expression of CAMs (ALCAM, PECAM-1, ICAM-1, VCAM-1, ICAM-2, and CD34) on primary culture of MBECs under resting or stimulated (stim.; TNF and IFNγ) conditions, isolated from WT and ALCAM KO mice, as assessed by flow cytometry. n = 4 independent experiments using four primary cultures. (B) Mean cumulative EAE clinical score of WT and ALCAM KO mice adoptively transferred with MOG35–55–reactivated WT splenocytes. Data shown are representative of n = 3 independent experiments, 20 animals per group. (C–E) Characterization of immune cells infiltrating the CNS of WT or ALCAM KO animals in the adoptive transfer EAE experiment, at 12 d posttransfer (shown in B). (C) Absolute numbers of immune cells isolated from the CNS of recipient mice. (D and E) Percentage of CNS-infiltrating immune cells expressing the surface markers CD4, CD11b, CD11c, and CD8 and percentage of ALCAM+, CD44hi, IFNγ+, and IL-17+ cells gated on the previous surface markers. Data shown are the mean ± SEM of 3–4 animals per group and representative of three transfer experiments. (F) Mean cumulative EAE clinical score of WT and ALCAM KO mice adoptively transferred with MOG35–55–reactivated ALCAM KO splenocytes. Data shown are representative of n = 3 independent experiments, with 26 WT and 20 ALCAM KO mice per group. (G–I) Characterization of immune cells infiltrating the CNS of WT or ALCAM KO animals in the adoptive transfer EAE experiment at 12 d posttransfer (shown in F). (G) Absolute numbers of immune cells isolated from the CNS of recipient mice. (H and I) Percentage of CNS-infiltrating immune cells expressing the surface markers CD4, CD11b, CD11c, and CD8 and percentage of ALCAM+, CD44hi, IFNγ+, and IL-17+ cells gated on the previous surface markers. Data shown are the mean ± SEM of four animals per group and representative of three transfer experiments. *P ≤ 0.05, **P ≤ 0.01, ***P ≤ 0.001.
Fig. S3.
Fig. S3.
Expression of adhesion molecules CD62E, Ninjurin-1, and MCAM on primary cultures of MBECs isolated from WT and ALCAM KO mice and stimulated with TNF and IFNγ (stim.) or under resting conditions, as assessed by flow cytometry. Data shown are the mean ± SEM of n = 4 independent experiments using four primary cultures. *P ≤ 0.05, **P ≤ 0.01.
Fig. 4.
Fig. 4.
ALCAM KO mice exhibit disorganized TJ molecules, which translates into an increase in transendothelial cell permeability. (A) TEER values of confluent monolayers of pMBMECs isolated from WT or ALCAM KO mice, expressed relative to WT values (1.0). Data shown are the mean ± SEM of seven independent experiments performed in triplicates. (B) Permeability coefficient of 10-kDa dextran and BSA across monolayers of MBECs, in vitro, from WT or ALCAM KO mice, either untreated or treated with TNF and IFNγ (stim.). Data shown are the mean ± SEM of 3–4 replicates per conditions and representative of n = 3 independent experiments. (C) In vivo BBB permeability using i.v. injected fluorescently labeled dextran (3 and 20 kDa) at different time points during EAE in WT and ALCAM KO mice. Data are expressed as a percentage of blood fluorescence intensity and measured by spectrofluorometer. Data shown are the mean ± SEM of 5–15 replicates per conditions pooled from n = 3 independent experiments. (D) Immunofluorescent staining of occludin (red; Left), α-catenin (green; Center), and ZO-1 (red; Right) in spinal cord sections of naïve ALCAM KO and WT mice. Nuclei, blue. (Scale bar, 20 µm.) Data are representative of five sections per animal and n = 4 animals per group. (E) Maximum pixel intensity analysis of junctional molecules in naïve ALCAM KO and WT spinal cord sections, as assessed by confocal microscopy. n = 25–65 blood vessels per group. (F) Maximum pixel intensity analysis of junctional molecules in primary culture of MBECs. n = 160–260 cell junctions per group. *P ≤ 0.05, **P ≤ 0.01, ***P ≤ 0.001.
Fig. S4.
Fig. S4.
(A) Immunofluorescence images of ALCAM KO (Top) and WT (Bottom) brain white matter (Left) and brain parenchymal tissue surrounding infiltrating meninges (Right). Tissue sections are stained for GFAP (red), pan-laminin (green), and nuclei (blue). (Scale bar, 15 µm.) Data are representative of four sections per animal. (B) Immunofluorescence images of ALCAM KO (Top) and WT (Bottom) brain peripheral meninges (Left), brain parenchymal tissue surrounding infiltrating meninges (Center), and brain white matter (Right). Tissue sections are stained for mouse IgGs (red), pan-laminin (green), and nuclei (blue). (Scale bar, 15 µm.) Data are representative of four sections per animal. (C) Immunofluorescence images of ALCAM KO (Top) and WT (Bottom) brain peripheral meninges (Left) and brain white matter (Right). Tissue sections are stained for fibrinogen (green), P120 (red), and nuclei (blue). (Scale bar, 15 µm.) Data are representative of four sections per animal.
Fig. 5.
Fig. 5.
ALCAM binds directly and indirectly to TJs. (A) Expression of ALCAM protein in whole-cell lysate from MBECs, in the control immunoprecipitation using nonspecific goat IgGs and in the ALCAM immunoprecipitation (IP) sample, by Western blot. (B) Immunoblot for ZO-2 (isoforms ± 160 kDa), cingulin (160 kDa), TARA (68 kDa), coronin 1C (57 kDa), β-actin (42 kDa), pan-TPM (isoforms ± 33 kDa), ZO-1 (240–260 kDa), occludin (65–80 kDa), ezrin (69 kDa), and syntenin-1 (33 kDa) on the ALCAM pull-down lysate (Center), the corresponding MBEC total cell lysate (Left), and the control IP (Right).

References

    1. Cayrol R, Haqqani AS, Ifergan I, Dodelet-Devillers A, Prat A. Isolation of human brain endothelial cells and characterization of lipid raft-associated proteins by mass spectroscopy. Methods Mol Biol. 2011;686:275–295. - PubMed
    1. Dodelet-Devillers A, et al. Functions of lipid raft membrane microdomains at the blood-brain barrier. J Mol Med (Berl) 2009;87(8):765–774. - PubMed
    1. Larochelle C, Alvarez JI, Prat A. How do immune cells overcome the blood-brain barrier in multiple sclerosis? FEBS Lett. 2011;585(23):3770–3780. - PubMed
    1. Tietz S, Engelhardt B. Brain barriers: Crosstalk between complex tight junctions and adherens junctions. J Cell Biol. 2015;209(4):493–506. - PMC - PubMed
    1. Alvarez JI, Cayrol R, Prat A. Disruption of central nervous system barriers in multiple sclerosis. Biochim Biophys Acta. 2011;1812(2):252–264. - PubMed

Publication types

MeSH terms

Substances