. 2016:2016:5648390.
doi: 10.1155/2016/5648390. Epub 2016 Dec 14.

Coordinated Plasticity between Barrel Cortical Glutamatergic and GABAergic Neurons during Associative Memory

Affiliations

Coordinated Plasticity between Barrel Cortical Glutamatergic and GABAergic Neurons during Associative Memory

Fenxia Yan et al. Neural Plast. 2016.

Abstract

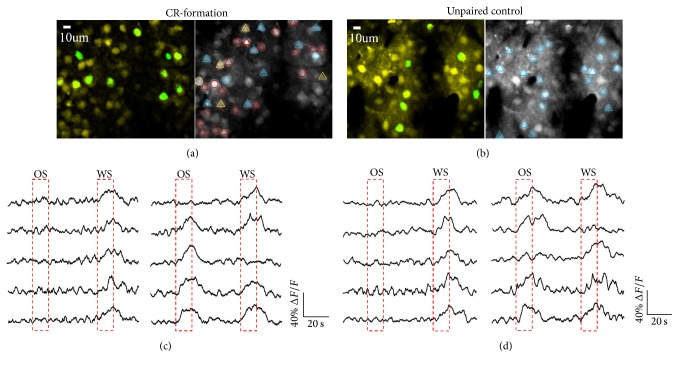
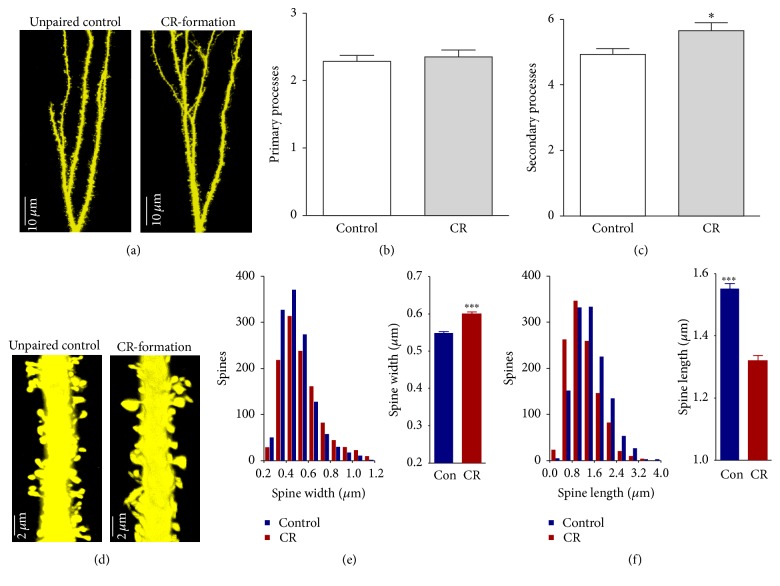
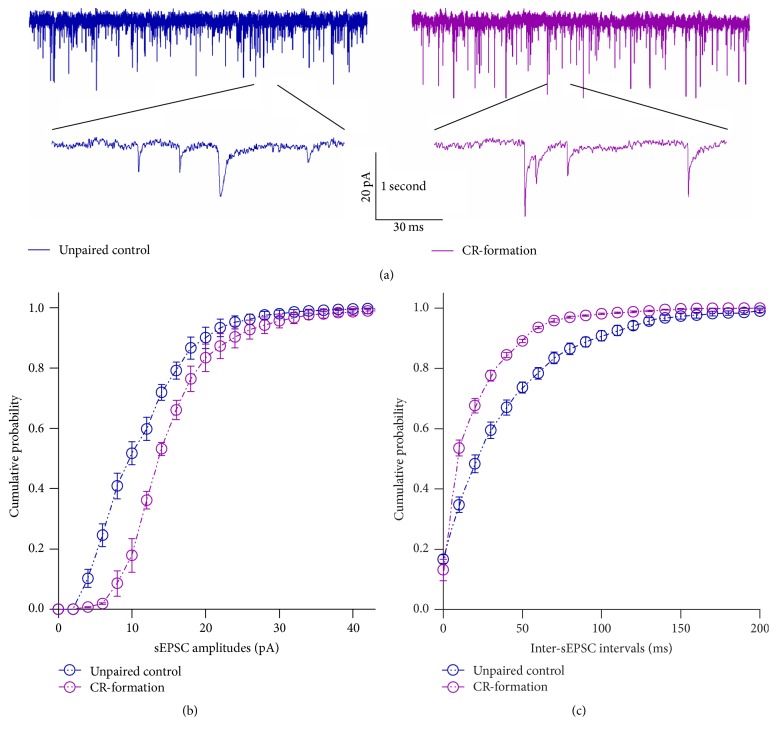
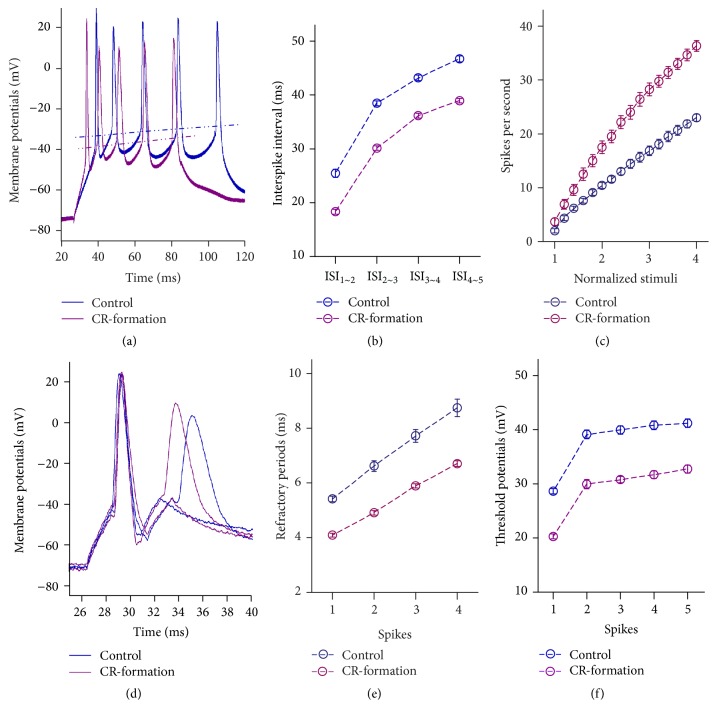
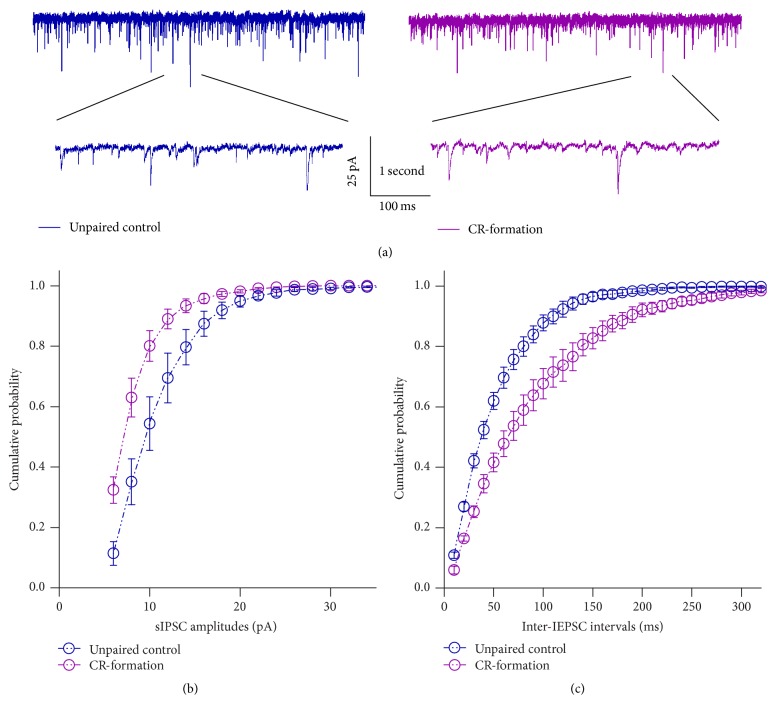
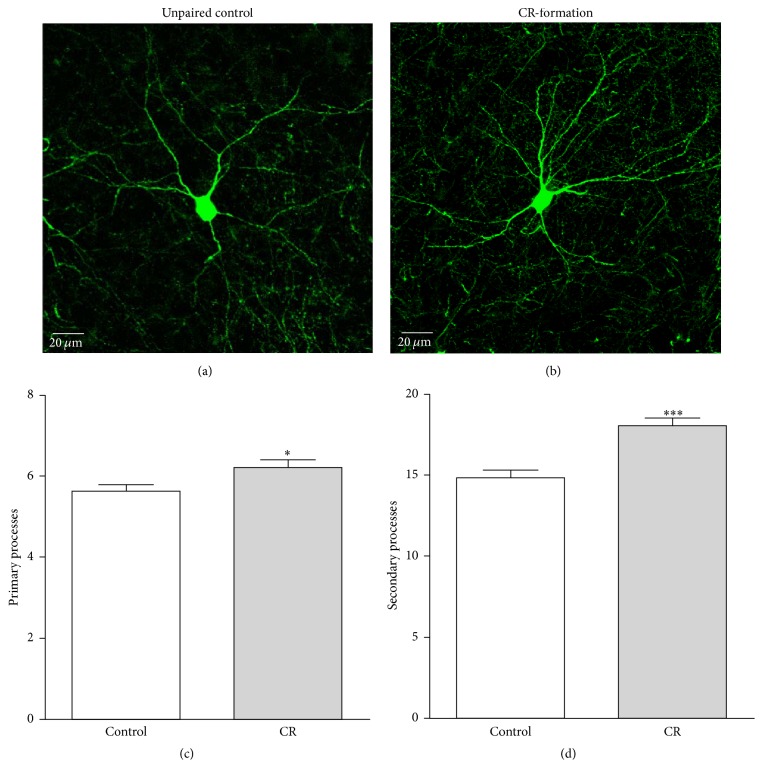
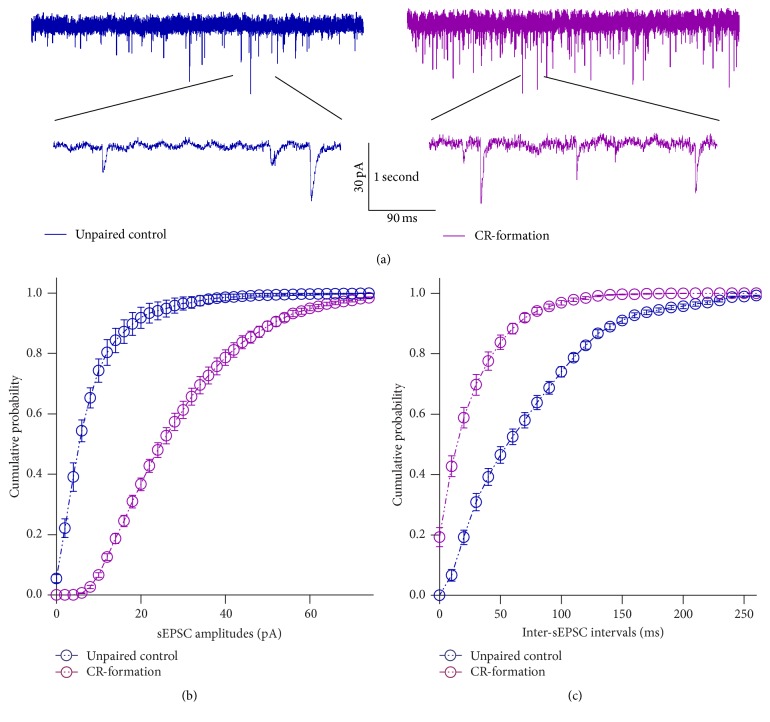
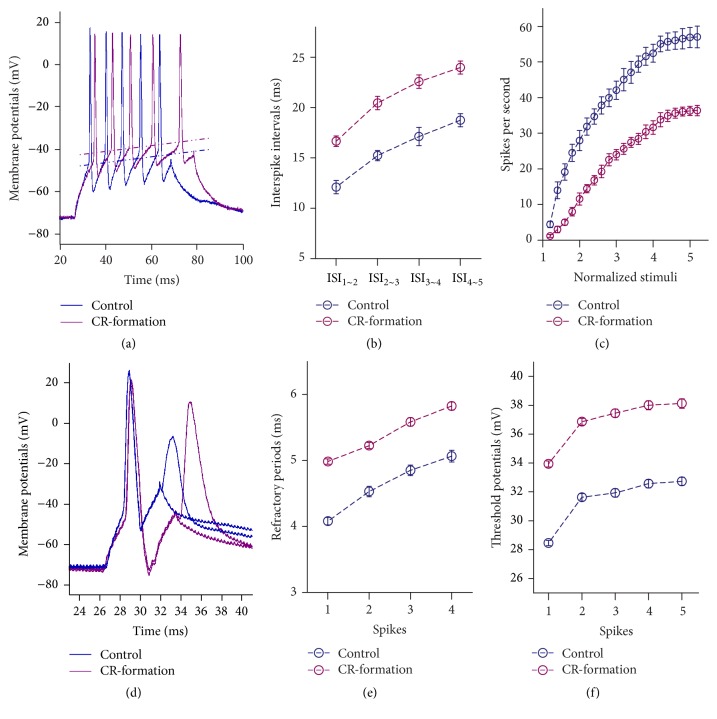
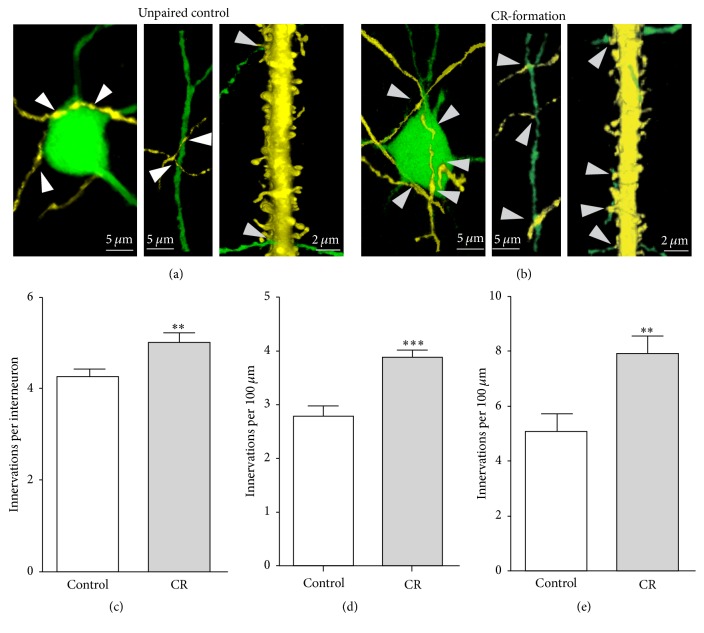
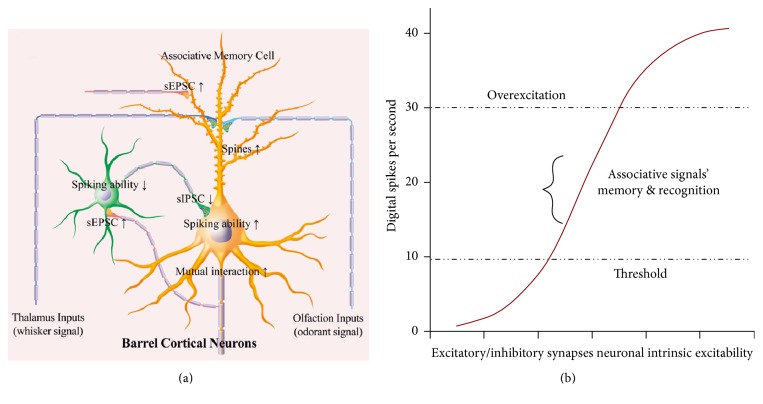
Neural plasticity is associated with memory formation. The coordinated refinement and interaction between cortical glutamatergic and GABAergic neurons remain elusive in associative memory, which we examine in a mouse model of associative learning. In the mice that show odorant-induced whisker motion after pairing whisker and odor stimulations, the barrel cortical glutamatergic and GABAergic neurons are recruited to encode the newly learnt odor signal alongside the innate whisker signal. These glutamatergic neurons are functionally upregulated, and GABAergic neurons are refined in a homeostatic manner. The mutual innervations between these glutamatergic and GABAergic neurons are upregulated. The analyses by high throughput sequencing show that certain microRNAs related to regulating synapses and neurons are involved in this cross-modal reflex. Thus, the coactivation of the sensory cortices through epigenetic processes recruits their glutamatergic and GABAergic neurons to be the associative memory cells as well as drive their coordinated refinements toward the optimal state for the storage of the associated signals.


Conflict of interest statement

All authors declare that they have no competing interests.

Figures

Figure 1
Figure 1
Glutamatergic and GABAergic neurons in the barrel cortex respond to the odor signal (OS) and whisker signal (WS) after their pairing. Cellular activities were detected by imaging Ca2+ signals under a two-photon microscope in control (n = 7) and CR-formation mice (n = 7), in which glutamatergic neurons were genetically labeled by YFP and GABAergic neurons were labeled by GFP. (a) Left panel shows the images of the glutamatergic neurons (yellow) and GABAergic neurons (green) in the barrel cortex from a CR-formation mouse. Right panel shows the neurons in response to WS and/or OS, which are defined as ΔF larger than 2.5-fold of standard deviation of baseline values. The neurons labeled by red are WS/OS-responsive cells. The neurons labeled by blue respond to WS. The neurons labeled by yellow respond to OS. (b) Left panel shows the images of glutamatergic neurons (yellow) and GABAergic neurons (green) in the barrel cortex from an unpaired control mouse. Right panel illustrates the neurons labeled by blue in response to WS. In (a)~(b), the glutamatergic neurons are marked as triangles and GABAergic neurons are marked as circles. (c) shows the digitized Ca2+ signals recorded from glutamatergic neurons in response to WS versus OS from unpaired control mouse (left panel) and CR-formation mouse (right). (d) shows the digitized Ca2+ signals recorded from GABAergic neurons in response to WS versus OS from an unpaired control mouse (left panel) and CR-formation mouse (right). The calibration bars are 40% ΔF/F and 20 seconds.
Figure 2
Figure 2
The number of dendrites and the head of the spines on barrel cortical glutamatergic neurons are upregulated after associative leaning. (a) shows the branches of the secondary processes appear denser in CR-formation mouse (right panel) than controls (left). (b) shows the comparisons of primary processes per apical dendrite in CR-formation (gray bar, n = 20 neurons) and controls (white; p = 0.3, n = 25). (c) shows the comparisons of the secondary processes per apical dendrite in CR-formation (gray bar, n = 20 neurons) and controls (white; asterisk, p < 0.05, n = 25). (d) The spine volume appears larger and the spine length is shorter on CR-formation neurons (right panel) than controls (left). (e)~(f) show the comparisons of spine widths (e) and lengths (f) from CR-formations (red bar, n = 1162) and controls (Con; blue bar, n = 1273). The spine head tends to be large and the spine length tends to be short (three asterisks, p < 0.001).
Figure 3
Figure 3
Excitatory synaptic transmission on barrel cortical pyramidal neurons increases after pairing WS and OS. Spontaneous excitatory postsynaptic currents (sEPSCs) were recorded on the pyramidal neurons in cortical slices under voltage-clamp (holding potential at −70 mV) in presence of 10 μM bicuculline. (a) shows sEPSCs recorded on the neurons in control (dark-blue trace in left panel) and CR-formation (dark-red in right). Bottom traces are the expanded waveforms selected from top traces. Calibration bars are 20 pA, 1 second (top) and 30 ms (bottom). (b) shows cumulative probability versus sEPSC amplitudes from control (dark-blue symbols, n = 16) and CR-formation neurons (dark-red symbols, n = 15). (c) illustrates cumulative probability versus inter-sEPSC intervals from control (dark-blue symbols, n = 16) and CR-formation (dark-red symbols, n = 15).
Figure 4
Figure 4
The capability to encode spikes on barrel cortical pyramidal neurons increases after pairing WS and OS. The spikes were induced by depolarization pulse under voltage-clamp recording on glutamatergic neurons in cortical slices. (a) Traces illustrate depolarization-induced spikes on the neurons from control (blue trace) and CR-formation (dark-red). (b) shows interspike intervals for spikes 1~2 to spikes 4~5 from controls (dark-blue symbols, n = 21) and CR-formations (dark-red symbols, n = 20). (c) shows spikes per second versus normalized stimuli from control (dark-blue symbols, n = 21) and CR-formation (dark-red symbols, n = 20). (d) Traces show the measurements of spike refractory periods on the neurons from controls (dark-blue trace) and CR-formations (dark-red). (e) shows refractory periods versus spikes 1 to 4 from controls (dark-blue symbols, n = 21) and CR-formations (dark-red symbols, n = 20). (f) shows the threshold potential versus spikes 1 to 5 from controls (dark-blue symbols, n = 21) and CR-formations (dark-red symbols, n = 20).
Figure 5
Figure 5
Inhibitory synaptic transmission on barrel cortical pyramidal neurons decreases after pairing WS and OS. Spontaneous inhibitory postsynaptic currents (sIPSCs) were recorded on glutamatergic neurons in cortical slices under voltage-clamp (holding potential at −65 mV) in presence of 10 μM CNQX and 40 μM D-AP5. (a) Traces show sIPSCs recorded on the neurons from controls (dark-blue in left panel) and CR-formation (dark-red in right). The bottom traces present the expanded waveforms selected from top traces. Calibration bars are 25 pA, 1 second (top) and 100 ms (bottom). (b) shows cumulative probability versus sIPSC amplitudes from CR-formation (dark-red symbols, n = 12) and control (dark-blue symbols, n = 12). (c) shows cumulative probability versus inter-sIPSC intervals from CR-formations (dark-red symbols, n = 12) and controls (dark-blue symbols, n = 12).
Figure 6
Figure 6
The processes of GABAergic neurons in the barrel cortices increase after pairing WS and OS. (a)~(b) illustrate that process branches appear denser in CR-formations (a) than controls (b). (c) Primary processes per GABAergic neuron are higher in CR-formation mice (gray bar, n = 43) than controls (white, n = 40; asterisk, p < 0.05). (d) The secondary process branches per neuron are higher in CR-formation (gray bar) than control mice (white bar, three asterisks, p < 0.001).
Figure 7
Figure 7
Excitatory synaptic transmission on barrel cortical GABAergic neurons increases after pairing WS and OS. Spontaneous excitatory postsynaptic currents (sEPSCs) were recorded on the GFP-labeled GABAergic neurons in cortical slices under voltage-clamp (holding potential at −65 mV) in presence of 10 μM bicuculline. (a) shows sEPSCs recorded on the neurons from controls (dark-blue in left panel) and CR-formation (dark-red in right). The bottom traces are the expanded waveforms selected from top traces. Calibration bars are 30 pA, 1 second (top) and 90 ms (bottom). (b) shows cumulative probability versus sEPSC amplitudes from control (dark-blue symbols, n = 12) and CR-formation (dark-red, n = 12). (c) shows cumulative probability versus inter-sEPSC intervals from controls (dark-blue symbols, n = 12) and CR-formation (dark-red symbols, n = 12).
Figure 8
Figure 8
The ability to encode spikes in barrel cortical GABAergic neurons decreases after pairing WS and OS. Spikes were induced by depolarization pulses under voltage-clamp recording on the GABAergic neurons in cortical slices. (a) illustrates depolarization-induced spikes on the neurons from controls (dark-blue trace) and CR-formation (dark-red). (b) shows interspike intervals for spikes 1~2 to spikes 4~5 from controls (dark-blue symbols, n = 21) and CR-formation (dark-red symbols, n = 22). (c) illustrates spikes per second versus normalized stimuli (input-output) from control (dark-blue symbol, n = 21) and CR-formation (dark-red, n = 22). (d) shows the measurement of spike refractory periods on the neurons from control (dark-blue trace) and CR-formation (dark-red). (e) shows refractory periods versus spikes 1 to 4 from controls (dark-blue symbols, n = 21) and CR-formation mice (dark-red symbols, n = 22). (f) illustrates threshold potentials versus spikes 1 to 5 from controls (dark-blue symbols, n = 21) and CR-formation (dark-red symbols, n = 22).
Figure 9
Figure 9
Mutual innervation between excitatory and inhibitory neurons is upregulated after associative learning. (a) shows YFP-labeled axon terminals on a GFP-labeled GABAergic neuron (left panel) and its process (middle) as well as GFP-labeled axon terminals on YFP-labeled apical dendrite of a glutamatergic neuron (right) from controls. (b) shows YFP-labeled axon terminals on a GFP-labeled GABAergic neuron (left panel) and its process (middle) as well as GFP-labeled axon terminals on YFP-labeled dendrite of a glutamatergic neuron (right) from CR-formation. White arrows indicate their termination. (c) shows YFP-labeled axon terminals on each GABAergic neuron in control (white bar) and CR-formation (gray, two asterisks, p < 0.01, n = 43). (d) shows YFP-labeled axon terminals per 100 μm GFP-labeled dendrite of GABAergic neurons in controls (white bar) and CR-formations (gray, three asterisks, p < 0.001, n = 26). (e) shows GFP-labeled axon terminals per 100 μm YFP-labeled apical dendrite of glutamatergic neurons in controls (white bar) and CR-formations (gray, two asterisks, p < 0.01, n = 19).
Figure 10
Figure 10
The coordinated recruitment and refinement of barrel cortical glutamatergic and GABAergic neurons set up their function state for information storage. (a) In addition to receiving whisker signal from the thalamus, associative memory cells in the barrel cortex receive odor signal from the piriform cortex after associative learning. In the glutamatergic neurons (orange), their dendritic spines are enriched, their excitatory synaptic transmissions are upregulated, and their receiving of inhibitory synaptic transmission is downregulated for their recruitments to be associative memory cells. The innervations from GABAergic axons are increased, such that the glutamatergic neurons are not overexcited. In the GABAergic neurons (green), their processes are enriched, their receptive fields of excitatory synaptic transmission are enhanced, and their innervation from the excitatory neurons is increased. Their synaptic outputs are decreased. The GABAergic neurons are homeostasis by coordinating their subcellular compartments. (b) An upregulation in the ratio of the excitatory synapses to the inhibitory synapses drives the digital spike encoding at the excitatory neurons over the threshold (out of “functional silence”) into an optimal state for the recruitment and refinement of associative memory cells. The extreme weakness of inhibitory synapses pushes these neurons to be overexcited for strong memory with no recognition. The curve of digital spikes is simulated based on our data, in which the normalized stimulations are integrated by the ratio of excitatory synapses to inhibitory synapses.

Similar articles

Cited by

References

    1. Byrne J. H. Cellular analysis of associative learning. Physiological Reviews. 1987;67(2):329–439. - PubMed
    1. Lansner A. Associative memory models: from the cell-assembly theory to biophysically detailed cortex simulations. Trends in Neurosciences. 2009;32(3):178–186. doi: 10.1016/j.tins.2008.12.002. - DOI - PubMed
    1. Wasserman E. A., Miller R. R. What's elementary about associative learning? Annual Review of Psychology. 1997;48:573–607. doi: 10.1146/annurev.psych.48.1.573. - DOI - PubMed
    1. Weinberger N. M. Specific long-term memory traces in primary auditory cortex. Nature Reviews Neuroscience. 2004;5(4):279–290. doi: 10.1038/nrn1366. - DOI - PMC - PubMed
    1. Holtmaat A., Svoboda K. Experience-dependent structural synaptic plasticity in the mammalian brain. Nature Reviews Neuroscience. 2009;10(9):647–658. doi: 10.1038/nrn2699. - DOI - PubMed

Publication types

MeSH terms

LinkOut - more resources