. 2017 Jan 4;2(1):e00297-16.
doi: 10.1128/mSphere.00297-16. eCollection 2017 Jan-Feb.

Gut Microbiome of the Canadian Arctic Inuit

Affiliations

Gut Microbiome of the Canadian Arctic Inuit

Catherine Girard et al. mSphere. .

Abstract

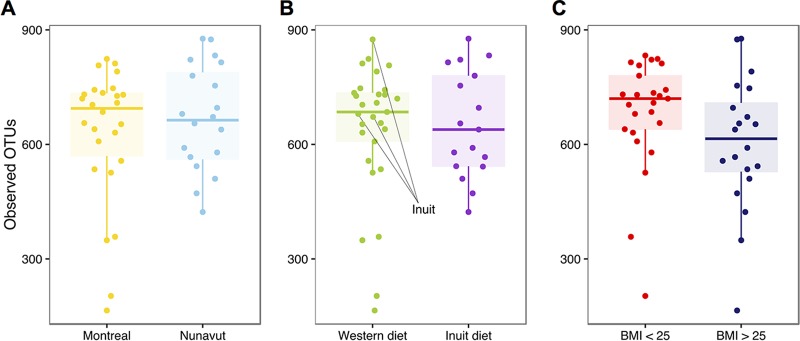
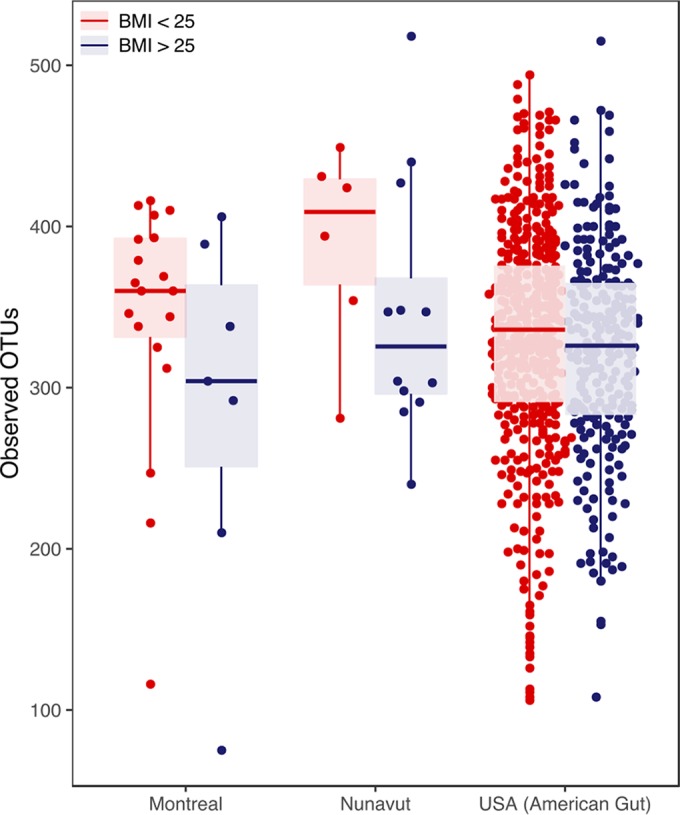
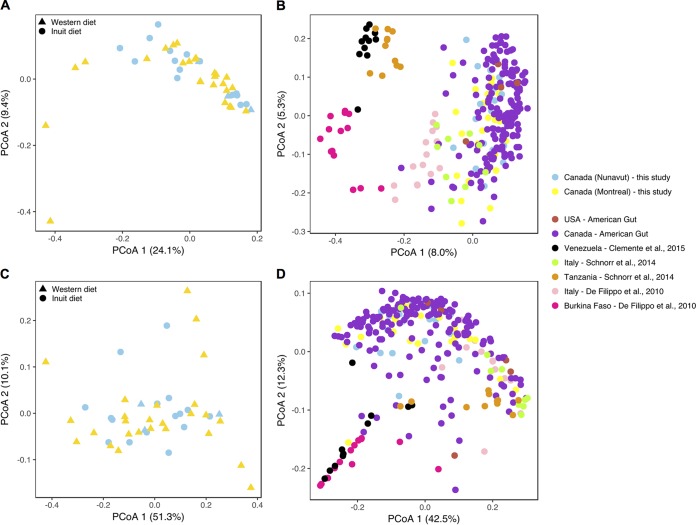
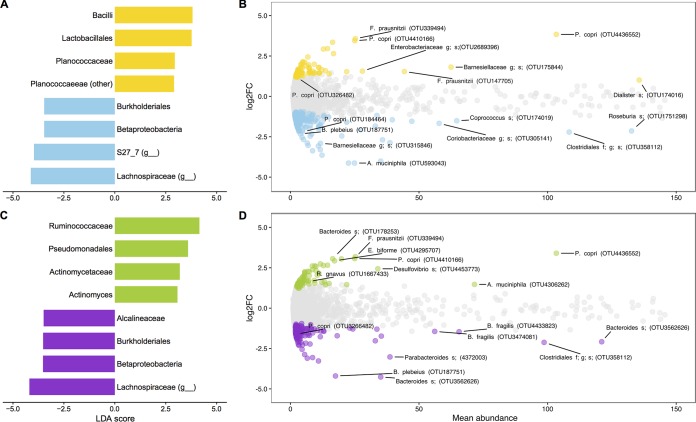
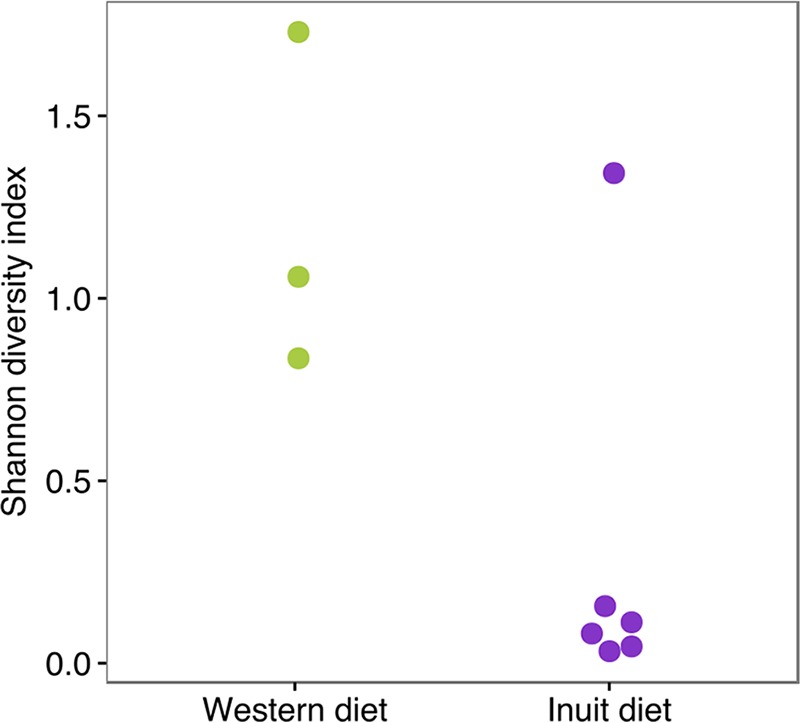
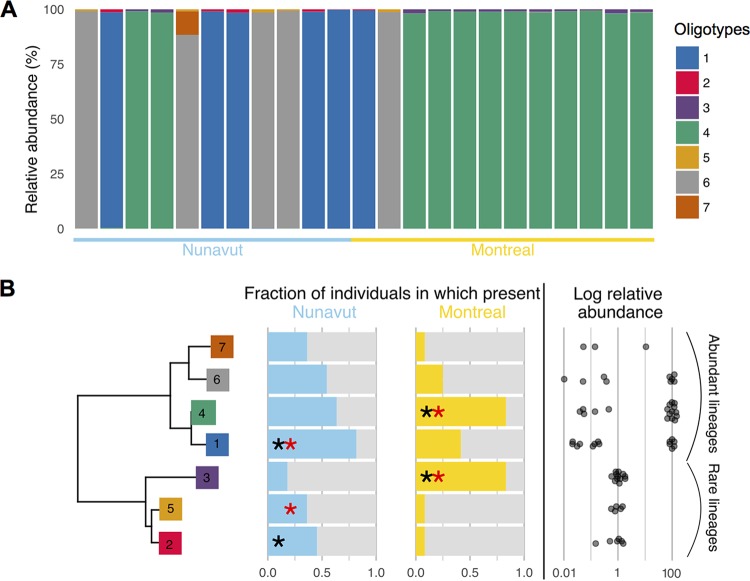
Diet is a major determinant of community composition in the human gut microbiome, and "traditional" diets have been associated with distinct and highly diverse communities, compared to Western diets. However, most traditional diets studied have been those of agrarians and hunter-gatherers consuming fiber-rich diets. In contrast, the Inuit of the Canadian Arctic have been consuming a traditional diet low in carbohydrates and rich in animal fats and protein for thousands of years. We hypothesized that the Inuit diet and lifestyle would be associated with a distinct microbiome. We used deep sequencing of the 16S rRNA gene to compare the gut microbiomes of Montrealers with a Western diet to those of the Inuit consuming a range of traditional and Western diets. At the overall microbial community level, the gut microbiomes of Montrealers and Inuit were indistinguishable and contained similar levels of microbial diversity. However, we observed significant differences in the relative abundances of certain microbial taxa down to the subgenus level using oligotyping. For example, Prevotella spp., which have been previously associated with high-fiber diets, were enriched in Montrealers and among the Inuit consuming a Western diet. The gut microbiomes of Inuit consuming a traditional diet also had significantly less genetic diversity within the Prevotella genus, suggesting that a low-fiber diet might not only select against Prevotella but also reduce its diversity. Other microbes, such as Akkermansia, were associated with geography as well as diet, suggesting limited dispersal to the Arctic. Our report provides a snapshot of the Inuit microbiome as Western-like in overall community structure but distinct in the relative abundances and diversity of certain genera and strains. IMPORTANCE Non-Western populations have been shown to have distinct gut microbial communities shaped by traditional diets. The hitherto-uncharacterized microbiome of the Inuit may help us to better understand health risks specific to this population such as diabetes and obesity, which increase in prevalence as many Inuit transition to a Western diet. Here we show that even Inuit consuming a mostly traditional diet have a broadly Western-like microbiome. This suggests that similarities between the Inuit diet and the Western diet (low fiber, high fat) may lead to a convergence of community structures and diversity. However, certain species and strains of microbes have significantly different levels of abundance and diversity in the Inuit, possibly driven by differences in diet. Furthermore, the Inuit diet provides an exception to the correlation between traditional diets and high microbial diversity, potentially due to their transitioning diet. Knowledge of the Inuit microbiome may provide future resources for interventions and conservation of Inuit heritage.

Keywords: Akkermansia; Inuit microbiome; Prevotella; Western diet; alpha diversity; oligotyping; traditional diet.


Figures

FIG 1
FIG 1
Similar levels of microbiome diversity across diet and geography. We observed no significant differences in levels of microbial taxonomic diversity in samples compared by geography (A), diet (B), or BMI (C) (Mann-Whitney test; P > 0.05). See Fig. S2 for other diversity indices. OTUs were identified by open reference OTU picking (see Materials and Methods). Box plots show the medians, and whiskers show 25% and 75% quartiles.
FIG 2
FIG 2
Comparison of levels of microbiome diversity by BMI, stratified by geography. To put our data in the context of a larger study, we performed closed-reference OTU picking to compare OTU counts across our data set and 1,000 random samples from the American Gut project. In all geographic regions (Montreal, Nunavut, and the United States), lean individuals (BMI = <25) had slightly higher diversity (number of observed OTUs) than overweight individuals (BMI >25), but the differences were not significant for any of the comparisons (Mann-Whitney test; P > 0.05). Box plots show the median, and whiskers show 25% and 75% quartiles.
FIG 3
FIG 3
The Inuit microbiome has a community composition similar to that of the Western microbiome. (A and C) Montreal and Nunavut microbiomes cluster together, regardless of diet, based on principal coordinates analysis of unweighted (A) and weighted (C) UniFrac distances computed from open-reference OTUs (see Materials and Methods). Gap statistics analyses identified only one cluster, showing that the two populations overlap at the overall microbial community level. (See Fig. S4A and B for additional distance metrics.) (B and D) Montreal and Nunavut microbiomes cluster with other Western microbiomes sampled in other studies. Interstudy comparisons were performed with unweighted (B) and weighted (D) UniFrac distances computed from closed-reference OTU tables to limit interstudy variability. Binning samples by traditional agrarian/hunter-gatherer populations (Burkina Fason, Tanzania, Venezuela) and Western populations (United States, Italy, Montreal, Nunavut) explains 6.5% and 10.5% of the variation in the combined data sets (adonis; P < 0.001) for unweighted and weighted UniFrac data, respectively.
FIG 4
FIG 4
Differentially abundant OTUs and higher taxonomic units across geography and diet. (A and C) Linear discriminant analyses (LDA) using LEfSe were applied to identify biomarkers at higher taxonomic levels (down to the genus level). (B and D) Differentially abundant OTUs were identified using DESeq2 (see Materials and Methods). (A and B) Samples were compared across geographic regions (for Montreal, n = 26 [in yellow]; for Nunavut, n = 19 [in blue]) for LEfSe biomarkers (A) and differentially abundant OTUs (B) identified by DESeq2. (C and D) Samples were compared by diet (for the Western diet, n = 29 [in green]; for the Inuit diet, n = 19 [in purple]) for LEFSe biomarkers (C) and differentially abundant OTUs (D) identified by DESeq2. All associations had P values of <0.05 after correction for multiple tests. Only the data from the top four LEfSe biomarkers (LDA score of >2.5) for each category are presented here. For full LEfSe and DESeq2 results, see Tables S1D to G and Fig. S6A to C. The differentially abundant OTUs named as indicated in panels B and D focus on those discussed in the main text.
FIG 5
FIG 5
Inuit diet is associated with low Prevotella diversity. Nunavut participants consuming a Western diet had a significantly greater diversity of Prevotella strains (Shannon diversity of oligotypes) than those adhering to the Inuit diet (Mann-Whitney test; P < 0.05).
FIG 6
FIG 6
Two distinct Akkermansia lineages, each containing strains associated with geography and diet. (A) Akkermansia strains (oligotypes 1 to 7) across samples (individuals). Only individuals with at least 100 Akkermansia reads are included. Percentages are relative to the total number of Akkermansia reads in the individual. Most individuals were dominated by one single strain (representing >88% of reads) of 7 strains identified. (B) Neighbor-joining tree (left) of oligotype sequences, with the fraction of individuals in which the oligotype is present, and its mean abundance within individuals (right). Stars indicate significant associations of oligotypes with geography (Nunavut versus Montreal; black stars) and diet (Western versus Inuit diet; red stars) (LEfSe; P < 0.05 after correction for multiple tests; Table S1H).

References

    1. Nicholson JK, Holmes E, Kinross J, Burcelin R, Gibson G, Jia W, Pettersson S. 2012. Host-gut microbiota metabolic interactions. Science 336:1262–1267. doi: 10.1126/science.1223813. - DOI - PubMed
    1. Turnbaugh PJ, Ley RE, Mahowald MA, Magrini V, Mardis ER, Gordon JI. 2006. An obesity-associated gut microbiome with increased capacity for energy harvest. Nature 444:1027–1031. doi: 10.1038/nature05414. - DOI - PubMed
    1. Cryan JF, Dinan TG. 2012. Mind-altering microorganisms: the impact of the gut microbiota on brain and behaviour. Nat Rev Neurosci 13:701–712. doi: 10.1038/nrn3346. - DOI - PubMed
    1. David LA, Maurice CF, Carmody RN, Gootenberg DB, Button JE, Wolfe BE, Ling AV, Devlin AS, Varma Y, Fischbach MA, Biddinger SB, Dutton RJ, Turnbaugh PJ. 2014. Diet rapidly and reproducibly alters the human gut microbiome. Nature 505:559–563. doi: 10.1038/nature12820. - DOI - PMC - PubMed
    1. David LA, Materna AC, Friedman J, Campos-Baptista MI, Blackburn MC, Perrotta A, Erdman SE, Alm EJ. 2014. Host lifestyle affects human microbiota on daily timescales. Genome Biol 15:R89. doi: 10.1186/gb-2014-15-7-r89. - DOI - PMC - PubMed

LinkOut - more resources