. 2016 Dec 14;2(12):e00214.
doi: 10.1016/j.heliyon.2016.e00214. eCollection 2016 Dec.

Dynamic relationships between ribosomal conformational and RNA positional changes during ribosomal translocation

Affiliations

Dynamic relationships between ribosomal conformational and RNA positional changes during ribosomal translocation

Ping Xie. Heliyon. .

Abstract

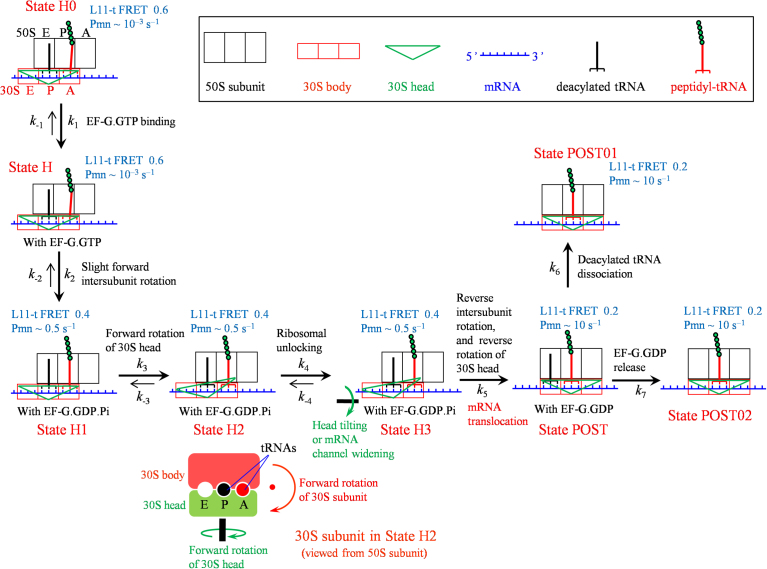
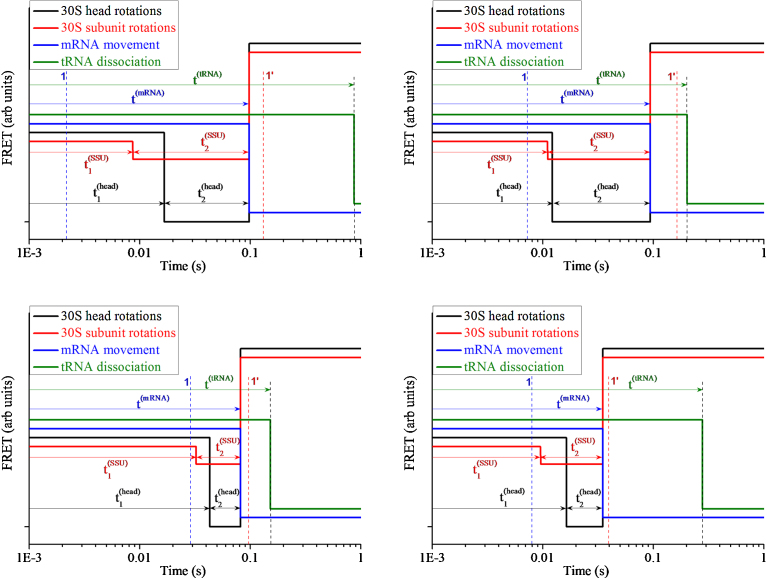
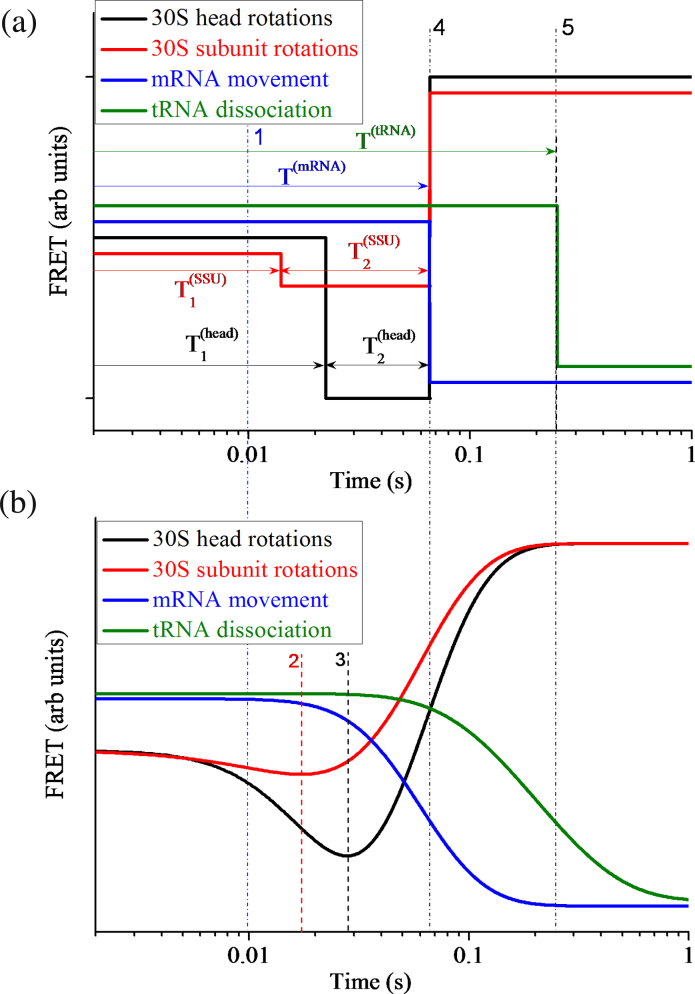
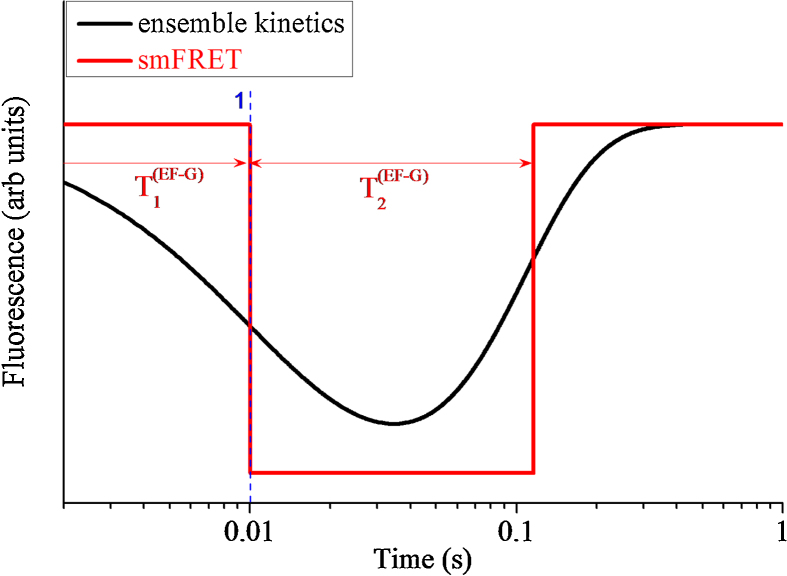
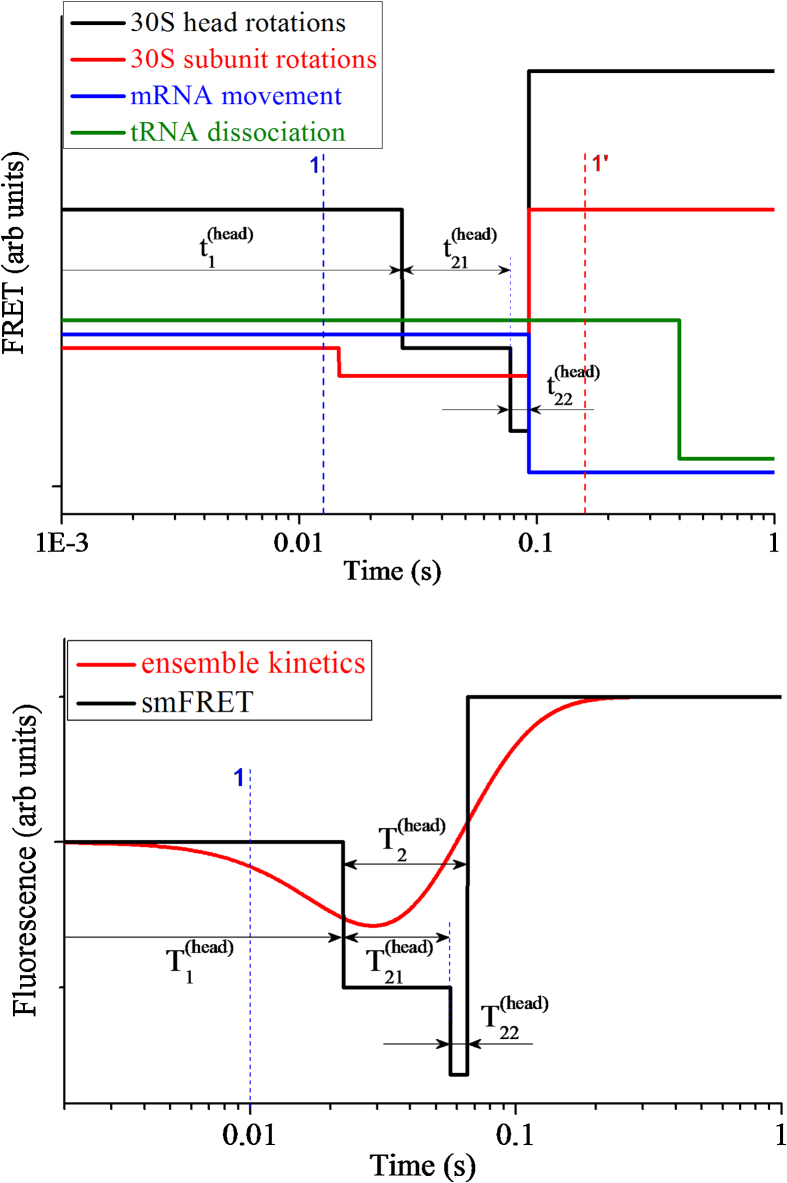
Ribosomal translocation catalyzed by EF-G hydrolyzing GTP entails multiple conformational changes of ribosome and positional changes of tRNAs and mRNA in the ribosome. However, the detailed dynamic relations among these changes and EF-G sampling are not clear. Here, based on our proposed pathway of ribosomal translocation, we study theoretically the dynamic relations among these changes exhibited in the single molecule data and those exhibited in the ensemble kinetic data. It is shown that the timing of these changes in the single molecule data and that in the ensemble kinetic data show very different. The theoretical results are in agreement with both the available ensemble kinetic experimental data and the single molecule experimental data.

Keywords: Biophysics; Mathematical Bioscience.


Figures

Fig. 1
Fig. 1
The minimal pathway of the ribosomal translocation catalyzed by EF-G hydrolyzing GTP (see text for detailed description). The panel below State H2 shows the interface view showing 30S subunit and head rotation in State H2. L11-t FRET denotes the FRET between Cy3-labeled ribosomal protein L11 and Cy5-labeled peptidyl-tRNA. The different values of L11-t FRET in different states are consistent with the available smFRET data . Note that the rates of reactivity of peptidyl-tRNA toward puromycin (denoted by Pmn) are in the order of 103s1 in State H0 and State H, in the order of 0.1–1 s1 in State H1, State H2 and State H3, and in the order of 10 s1 in State POST, State POST01 and State POST02, which are consistent with the available biochemical data .
Fig. 2
Fig. 2
Four examples of time courses of smFRET data characterizing 30S head rotations (S13-L33 FRET), 30S subunit rotations (S6-L9 FRET), mRNA movement (Alx405 fluorescence) and tRNA dissociation (tRNA-L33 FRET). The four examples correspond to the smFRET data observed simultaneously in four different ribosomal complexes. Line 1 (blue broken line) represents the moment when EF-G.GTP binds to the ribosome and line 1′ (red broken line) represents the moment when EF-G.GDP releases from the ribosome. For clarity, throughout the paper the four smFRET data are shifted in the vertical axis relatively with each other.
Fig. 3
Fig. 3
Average smFRET data characterizing 30S head rotations (S13-L33 FRET), 30S subunit rotations (S6-L9 FRET), mRNA movement (Alx405 fluorescence) and tRNA dissociation (tRNA-L33 FRET). (a) Time courses of single smFRET data with the time when the smFRET changes value being replaced with the average time. (b) Time courses of ensemble smFRET data (with N 10000) or ensemble kinetic data calculated with differential equations (11)–(21). Line 1 (blue broken line) represents the average time when EF-G.GTP binds to the ribosome, line 4 represents the average time when the reverse 30S subunit, the reverse 30S head and the mRNA movement take place, and line 5 represents the average time when the deacylated tRNA dissociates from the E/E site of the ribosome. Line 2 in (b) represents the time when the ensemble FRET data characterizing 30S head rotations begin to increase, with the decrease of FRET data corresponding to the forward 30S head rotation while the increase of FRET data corresponding to the reverse 30S head rotation. Line 3 in (b) represents the time when the ensemble FRET data characterizing 30S subunit rotations begin to increase, with the decrease of FRET data corresponding to the forward 30S subunit rotation while the increase of FRET data corresponding to the reverse 30S subunit rotation.
Fig. 4
Fig. 4
Average smFRET data characterizing EF-G dissociation (L12–EF-G FRET). Red line represents the time course of single smFRET data with the time when the smFRET changes value being replaced with the average time. Black line represents time course of ensemble smFRET data (with N 10000) or ensemble kinetic data calculated by using differential equations (11)–(15) and equations (22)–(24).
Fig. 5
Fig. 5
Time courses of smFRET data and ensemble kinetic data characterizing 30S head rotations (S13-L5 FRET). (a) An example of the time course of the smFRET data characterizing 30S head rotations (S13-L5 FRET). For comparison, time courses of smFRET data characterizing 30S subunit rotations (S6-L9 FRET), mRNA movement (Alx405 fluorescence) and tRNA dissociation (tRNA-L33 FRET) are also shown. Line 1 (blue broken line) represents the time when EF-G.GTP binds to the ribosome and line 1′ (red broken line) represents the time when EF-G.GDP releases from the ribosome. (b) Average smFRET data characterizing 30S head rotations (S13-L5 FRET). Black line represents the time course of single smFRET data with the time when the smFRET changes value being replaced with the average time. Red line represents the time course of ensemble smFRET data (with N 10000) or ensemble kinetic data calculated with differential equations (11)–(17) and equation (25). Line 1 (blue broken line) represents the average time when EF-G.GTP binds to the ribosome.

Similar articles

Cited by

References

    1. Frank J., Agrawal R.K. A ratchet-like inter-subunit reorganization of the ribosome during translocation. Nature. 2000;406:318–322. - PubMed
    1. Valle M., Zavialov A., Sengupta J., Rawat U., Ehrenberg M., Frank J. Locking and unlocking of ribosomal motions. Cell. 2003;114:123–134. - PubMed
    1. Cornish P.V., Ermolenko D.N., Noller H.F., Ha T. Spontaneous intersubunit rotation in single ribosomes. Mol. Cell. 2008;30:578–588. - PMC - PubMed
    1. Agirrezabala X., Lei J., Brunelle J.L., Ortiz-Meoz Rodrigo F., Green R., Frank J. Visualization of the hybrid state of tRNA binding promoted by spontaneous ratcheting of the ribosome. Mol. Cell. 2008;32:190–197. - PMC - PubMed
    1. Julián P., Konevega A.L., Scheres S.H.W., Lázaro M., Gil D., Wintermeyer W., Rodnina M.V., Valle M. Structure of ratcheted ribosomes with tRNAs in hybrid states. Proc. Natl. Acad. Sci. U. S. A. 2008;105:16924–16927. - PMC - PubMed

LinkOut - more resources