. 2017 Feb;59(2):135-145.
doi: 10.1007/s00234-016-1769-8. Epub 2017 Jan 9.

Advanced MRI assessment to predict benefit of anti-programmed cell death 1 protein immunotherapy response in patients with recurrent glioblastoma

Affiliations

Advanced MRI assessment to predict benefit of anti-programmed cell death 1 protein immunotherapy response in patients with recurrent glioblastoma

Lei Qin et al. Neuroradiology. 2017 Feb.

Abstract

Introduction: We describe the imaging findings encountered in GBM patients receiving immune checkpoint blockade and assess the potential of quantitative MRI biomarkers to differentiate patients who derive therapeutic benefit from those who do not.

Methods: A retrospective analysis was performed on longitudinal MRIs obtained on recurrent GBM patients enrolled on clinical trials. Among 10 patients with analyzable data, bidirectional diameters were measured on contrast enhanced T1 (pGd-T1WI) and volumes of interest (VOI) representing measurable abnormality suggestive of tumor were selected on pGdT1WI (pGdT1 VOI), FLAIR-T2WI (FLAIR VOI), and ADC maps. Intermediate ADC (IADC) VOI represented voxels within the FLAIR VOI having ADC in the range of highly cellular tumor (0.7-1.1 × 10⁻³ mm2/s) (IADC VOI). Therapeutic benefit was determined by tissue pathology and survival on trial. IADC VOI, pGdT1 VOI, FLAIR VOI, and RANO assessment results were correlated with patient benefit.

Results: Five patients were deemed to have received therapeutic benefit and the other five patients did not. The average time on trial for the benefit group was 194 days, as compared to 81 days for the no benefit group. IADC VOI correlated well with the presence or absence of clinical benefit in 10 patients. Furthermore, pGd VOI, FLAIR VOI, and RANO assessment correlated less well with response.

Conclusion: MRI reveals an initial increase in volumes of abnormal tissue with contrast enhancement, edema, and intermediate ADC suggesting hypercellularity within the first 0-6 months of immunotherapy. Subsequent stabilization and improvement in IADC VOI appear to better predict ultimate therapeutic benefit from these agents than conventional imaging.

Keywords: ADC; GBM; Immunotherapy; MRI; Pseudoprogression.


Figures

Fig.1
Fig.1
a Pre- and post-Gd T1WI subtraction highlights the lesion in the subtracted T1 image. b ROI copied from FLAIR to ADC, and threshold of intermediate ADC (0.7–1.1) × 10−3 mm2/s was applied inside the ROI. Volume measured from ADC map is the yellow region inside the ROI
Fig. 2
Fig. 2
Patient #6 from Table 1. Preoperative axial MR images (top row) of the area of treated tumor that was subsequently biopsied include: (i) FLAIR T2WI demonstrating vasogenic edema, (ii) pGd T1WI demonstrating abnormal enhancement due to high vascular permeability, (iii) ADC map demonstrating predominantly high ADC suggestive edema and necrosis admixed with infiltrative tumor, and (iv) ADC map with IADC area segmented in yellow suggesting a small central area of cellular tumor. Histopathologic images from biopsy (middle and bottom row) include: a Low-power field of area of treated tumor showing a large swath of geographic necrosis (left of arrows), bordered by granulation tissue (right of arrows). Tumor cells are admixed; b high-power field of granulation tissue highlighting treatment effects including macrophages (arrows) with scattered admixed reactive astrocytes (arrowheads) in a background of newly formed blood vessels and edematous stroma, c high-power field of area of geographic necrosis showing scattered tumor cells (arrows), and d astain for CD68 highlighting numerous macrophages (brown, arrows), phagocytosing necrotic debris
Fig. 3
Fig. 3
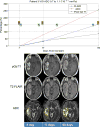
Representative significant benefit patient (patient # 8 from Table 1). On the graph, green highlighted letters indicate dates of Nivolumab(N) and Ipilumumab (I) dosing. The brown highlighted numbers indicate the decadron dose (mg/day). ADC volume begin to decrease between day 120 ~ 175. Corresponding MRI images illustrated below include pGd-T1WI axial and sagittal images in the top two rows, FLAIR-T2WI in the third row, and ADC in the bottom row. The sagittal images with the selected VOI shown in red are included to illustrate that pGd enhancing tumor volume decreases from day 42–84 and increases from day 120–175 although this is not as apparent on the axial sections due to the unusual shape of the tumor
Fig. 4
Fig. 4
a Representative no clinical benefit patient (patient # 3 from Table 1). On the graph, green highlighted letters indicate dates of Nivolumab (N). The brown highlighted numbers indicate the decadron dose (mg/day). Corresponding MRI images illustrated below include pGd-T1WI (upper), FLAIR-T2WI (middle), and ADC (lower) panels. b Representative no clinical benefit patient demonstrating utility of ADC in setting of increasing corticosteroid dose (patient # 2 from Table 1). On the graph, the green highlighted letters indicate dates of Nivolumab (N). The brown highlighted numbers indicate the decadron dose (mg/day). Corresponding MRI images illustrated below include pGd-T1WI (upper), FLAIR-T2WI (middle), and ADC (lower) panels. The large increase in decadron dose on day 83 likely accounts for the substantial decrease in volume of abnormal enhancement on pGd T1 and edema on FLAIR T2WI, despite worsening clinical status. Although steroids may increase the rate of growth of the abnormal ADC volume, this continuing ADC volume increase is likely in large part due to tumor growth and helps to distinguish this steroid induced “pseudoresponse” from true therapeutic improvement in which abnormal ADC volume decreases
Fig. 4
Fig. 4
a Representative no clinical benefit patient (patient # 3 from Table 1). On the graph, green highlighted letters indicate dates of Nivolumab (N). The brown highlighted numbers indicate the decadron dose (mg/day). Corresponding MRI images illustrated below include pGd-T1WI (upper), FLAIR-T2WI (middle), and ADC (lower) panels. b Representative no clinical benefit patient demonstrating utility of ADC in setting of increasing corticosteroid dose (patient # 2 from Table 1). On the graph, the green highlighted letters indicate dates of Nivolumab (N). The brown highlighted numbers indicate the decadron dose (mg/day). Corresponding MRI images illustrated below include pGd-T1WI (upper), FLAIR-T2WI (middle), and ADC (lower) panels. The large increase in decadron dose on day 83 likely accounts for the substantial decrease in volume of abnormal enhancement on pGd T1 and edema on FLAIR T2WI, despite worsening clinical status. Although steroids may increase the rate of growth of the abnormal ADC volume, this continuing ADC volume increase is likely in large part due to tumor growth and helps to distinguish this steroid induced “pseudoresponse” from true therapeutic improvement in which abnormal ADC volume decreases

References

    1. DeAngelis LM, Wen PY. Primary and metastatic tumors of the nervous system. In: Longo DL, Kasper DL, Hauser SL, Jameson J, Loscalzo J, editors. Harrison’s principles of internal medicine. 2012.
    1. Avril T, Vauleon E, Tanguy-Royer S, Mosser J, Quillien V. Mechanisms of immunomodulation in human glioblastoma. Immunotherapy. 2011;3:42–44. - PubMed
    1. Wolchok JD, Kluger H, Callahan MK, et al. Nivolumab plus ipilimumab in advanced melanoma. N Engl J Med. 2013;369:122–133. - PMC - PubMed
    1. Ansell SM, Lesokhin AM, Borrello I, et al. PD-1 blockade with nivolumab in relapsed or refractory Hodgkin’s lymphoma. N Engl J Med. 2015;372:311–319. - PMC - PubMed
    1. Reardon DA, Gokhale PC, Klein SR, et al. Glioblastomaeradication following immune checkpoint blockade in an orthotopic, Immunocompetentmodel. Cancer Immunol Res. 2016;4:124–135. - PubMed

MeSH terms