. 2017 Apr;13(2):226-243.
doi: 10.1007/s12015-016-9713-1.

Exosome and Microvesicle-Enriched Fractions Isolated from Mesenchymal Stem Cells by Gradient Separation Showed Different Molecular Signatures and Functions on Renal Tubular Epithelial Cells

Affiliations

Exosome and Microvesicle-Enriched Fractions Isolated from Mesenchymal Stem Cells by Gradient Separation Showed Different Molecular Signatures and Functions on Renal Tubular Epithelial Cells

Federica Collino et al. Stem Cell Rev Rep. 2017 Apr.

Abstract

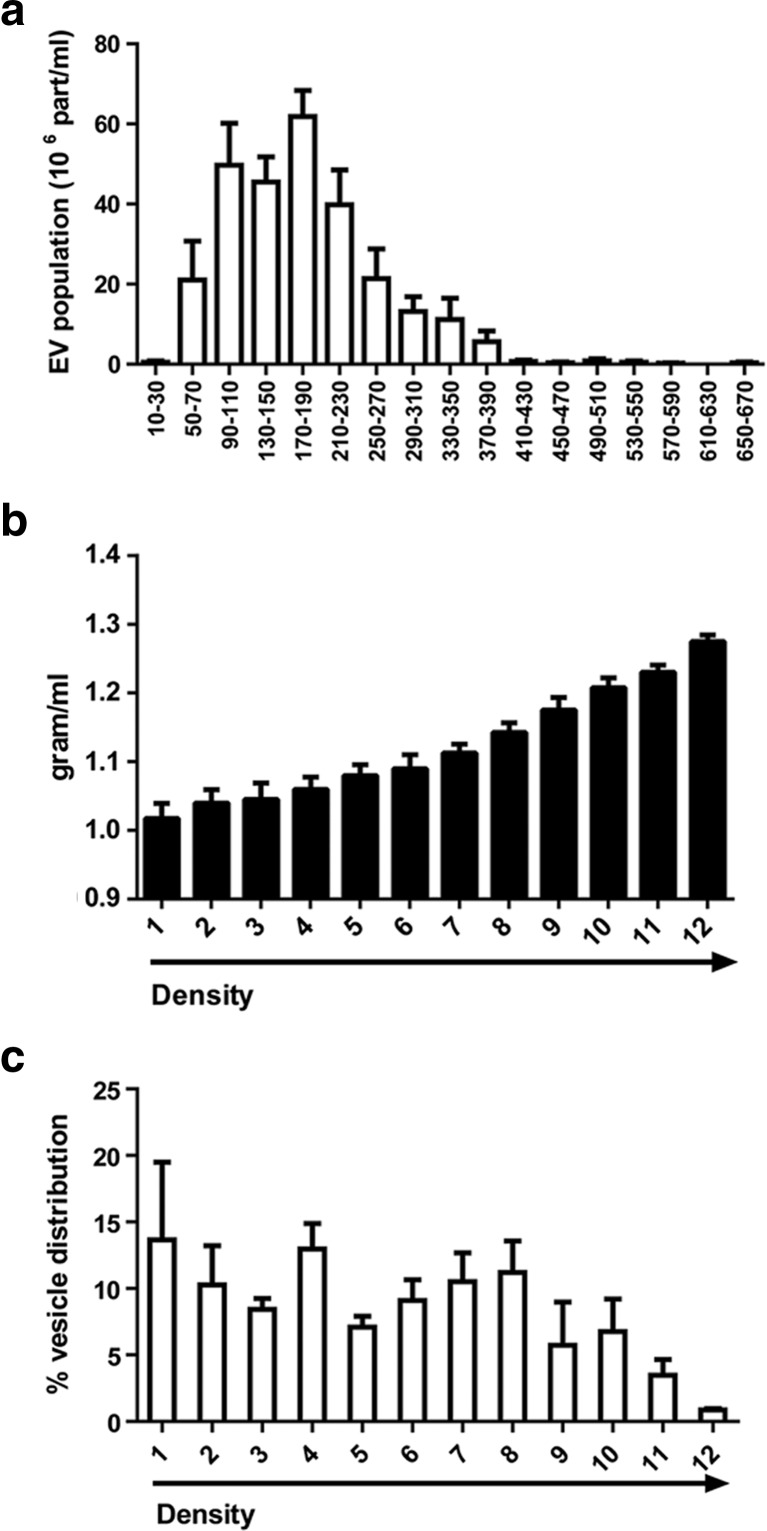
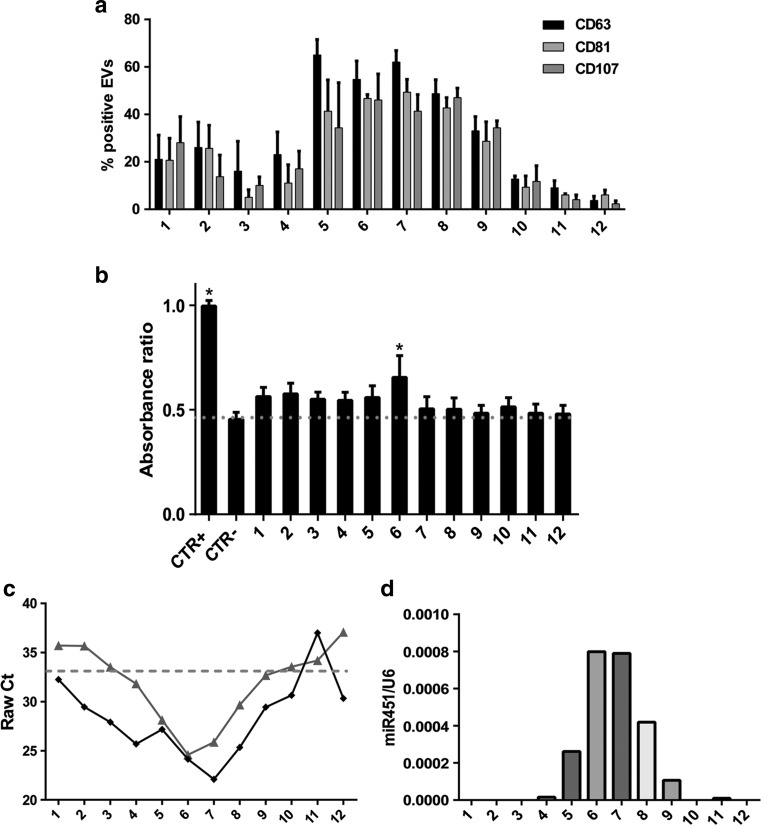
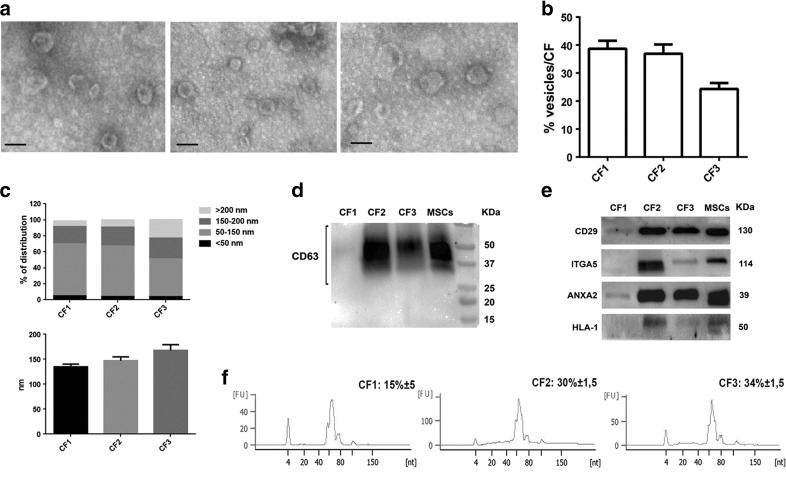
Several studies have suggested that extracellular vesicles (EVs) released from mesenchymal stem cells (MSCs) may mediate MSC paracrine action on kidney regeneration. This activity has been, at least in part, ascribed to the transfer of proteins/transcription factors and different RNA species. Information on the RNA/protein content of different MSC EV subpopulations and the correlation with their biological activity is currently incomplete. The aim of this study was to evaluate the molecular composition and the functional properties on renal target cells of MSC EV sub-populations separated by gradient floatation. The results demonstrated heterogeneity in quantity and composition of MSC EVs. Two peaks of diameter were observed (90-110 and 170-190 nm). The distribution of exosomal markers and miRNAs evaluated in the twelve gradient fractions showed an enrichment in fractions with a flotation density of 1.08-1.14 g/mL. Based on this observation, we evaluated the biological activity on renal cell proliferation and apoptosis resistance of low (CF1), medium (CF2) and high (CF3) floatation density fractions. EVs derived from all fractions, were internalized by renal cells, CF1 and CF2 but not CF3 fraction stimulated significant cell proliferation. CF2 also inhibited apoptosis on renal tubular cells submitted to ischemia-reperfusion injury. Comparative miRNomic and proteomic profiles reveal a cluster of miRNAs and proteins common to all three fractions and an enrichment of selected molecules related to renal regeneration in CF2 fraction. In conclusion, the CF2 fraction enriched in exosomal markers was the most active on renal tubular cell proliferation and protection from apoptosis.

Keywords: Acute kidney injury; Exosomes; Extracellular vesicles; Kidney regeneration; Mesenchymal stem cells; Microvesicles.


Conflict of interest statement

The authors indicate no potential conflicts of interest.

Figures

Fig. 1
Fig. 1
Characterization of EVs isolated from the conditioned medium (CM) of human MSCs and subjected to OptiPrep gradient separation. a Nanoparticle Tracking Analysis (NTA) profiles of particle size and distribution of EVs present in the concentrated CM of MSCs (cCM-EVs). cCM-EVs represent a extracellular vesicle population containing exosomes and microvesicles. Two peaks around 90–110 and 170–190 nm were detected. b Weight of the twelve different EV fractions generated by gradient separation of cCM-EVs. c NTA analysis of the percentage of EVs distributed in different fractions after gradient separation. Data reported are mean ± SEM of four different experiments
Fig. 2
Fig. 2
Characterization of specific exosome markers and activity of the twelve EV fractions isolated by gradient separation. a FACS analysis of the expression of the tetraspanin members, CD63 and CD81 and the lysosomal-associated protein, CD107 in different EV fractions. The exosome markers showed a relevant co-localization in fractions 5–8, characterized by a flotation density of 1.08–1.14 g/mL. b Evaluation of the effects of different EV fractions on mTEC proliferation after 48 h of stimulation, assessed by BrdU up-take (1 × 107 EVs/ml) in respect to control cells (CTR-, DMEM no FCS). Cells cultured in DMEM plus 10% FCS were used as positive control (CTR + =1). Data are expressed as Ratio means ±SEM. ANOVA with Dunnett’s multicomparison test. *P < 0.05 vs CTR-. c Representive qRT-PCR expression of miR-21 and miR-451 in the twelve fractions. Raw data analysis of miR-21(formula image) shows its expression in almost all the EV fractions. On the contrary, miR-451 (formula image) shows selective compartmentalization in the central fractions. d Representative qRT-PCR analysis showing the relative quantity of miR-451 in respect to the synthetic spike-in (UniSp6) used as normalizer. Normalized data showed the distribution of miR-451 inside the exosome-enriched EV fractions. Three experiments were conducted with similar results
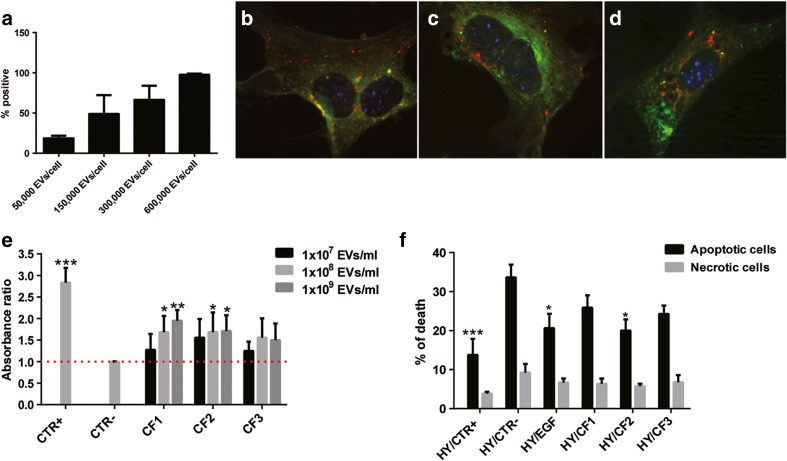
Fig. 3
Fig. 3
Activity of the combined gradient fractions on tubular cell proliferation and apoptosis. a Quantitative FACS analysis of the up-take of labelled cCM-EVs by mTEC. A dose dependent up-take of cCM-EVs (50,000–600,000 EVs/cell) was observed after incubation for 24 h. b-d Representative micrograph of the internalization of EVs from CF1 (b), CF2 (c) and CF3 (d) by mTEC after 24 h, observed by confocal microscopy. EVs were collected from MSCs double-stained with Syto-RNA (green) and Vybrant Dil (red). Three experiments were performed with similar results. Nuclei were counterstained with Hoechst dye. Original magnification: ×630. (E-F) Evaluation of the effects of the combined fractions on mTEC proliferation (e) and protection from apoptosis (f). e Absorbance ratio of the BrdU up-take by mTEC incubated for 48 h with EVs from different CFs (1 × 107 EVs/ml, 1 × 108 EVs/ml or 1 × 109 EVs/ml) in respect to control cells (CTR-, DMEM no FCS). Cells cultured in DMEM plus 10% FCS were used as positive control (CTR+). f Cell death analysis on mTEC subjected to hypoxia/reperfusion was measured by Muse™ Caspase-3/7 Kit. Cells were subjected to hypoxia for 48 h, then EVs from CFs were added during the 24 h of reperfusion (1 × 107 EVs/ml). Cells maintained in the absence of serum were used as negative control (HY/CTR-). Cells cultured in DMEM plus 10% FCS in the reperfusion phase were used as positive control (HY/CTR+). Black bars indicate apoptosis and grey bars represent necrosis. Data are expressed as means ±SEM. ANOVA with Dunnett’s multicomparison test. *P < 0.05, **P < 0.01, ***P < 0.001 vs CTR- or HYP/CTR-, respectively
Fig. 4
Fig. 4
Characterization of morphology, protein surface and miRNA content of combined fraction EVs. a Transmission electron microscopy (original magnification × 75,000) of EVs from different CFs. All the CFs contain vesicles with a typical cup-shaped morphology (scale bar 100 nm). Particles with a different electron density were observed in the CF3 fraction. b Percentage of EVs isolated for each combined fraction detected by NTA. The CF3 resulted the fraction with less EVs in respect to the low-density CF1 and medium-density CF2 fractions. c Percentage of size distribution of EVs in different CF fractions measured by NTA (upper panel). The mean diameter (nm) of each CF populations was also measured (lower panel). Four different gradients were tested in triplicate. (d-e) Representative Western blot analysis of CD63 (d), integrin β1 (CD29), α5-integrin (ITGA5), annexin A2 (ANXA2) and HLA-class I (e) on MSCs and CF derived EVs. Three different experiments were performed with similar results. (f) Representative bioanalyzer profile of small RNAs performed on EVs from the CFs, showing a relevant enrichment of total miRNAs in the medium density CF2 and high density CF3 fractions in respect to CF1. Three different samples tested in triplicate with similar results
Fig. 5
Fig. 5
Analysis of miRNA compartmentalization inside the CF fractions. a Quantification of the total RNA isolated from the different CFs. Data are expressed as means ±SEM (ng RNA/EV) of four different experiments. No significant differences were observed among the three fractions. (b-e) qRT-PCR profile of 754 mature miRNAs in the CF fractions. b Scatter plot of normalized Cycle threshold distribution (∆Ct) of all expressed miRNAs (Ct < 40) between CF2 and the other fractions. Pearson correlation was calculated (CF2 vs CF3: 0.50 and vs CF1: 0.69). c Venn diagram showing the miRNAs present in all the EV fractions (n = 162). A subset of miRNAs was specific of the medium-density CF2 EVs and undetected in the others. Fold change distribution of the co-expressed miRNAs (miRNA intersection) between CF1 and CF2 fractions (d) and between CF3 and CF2 fractions (e), showing a general enrichment of miRNAs in fraction CF2. (f) Validation of the different compartmentalization of specific miRNAs in CFs. The expression of miRNAs enriched in MSC EVs and/or connected with kidney regeneration was analyzed by qRT-PCR. All the miRNAs tested were reduced in CF1, demonstrating less ability of this fraction to compartmentalize miRNAs. The relative quantity of each miRNA (RQ) was measured using the synthetic spike-in (UniSp2) as normalizer. Three different samples tested in triplicate with similar results. Data are expressed as means ±SEM. ANOVA with Dunnett’s multicomparison test. *P < 0.05 vs CF2
Fig. 6
Fig. 6
Heatmap representation of the most significantly enriched pathways potentially modulated by the selective/enriched miRNAs in CF2 fraction. Enrichment analysis of the pathways over-represented by the predicted targets of enriched/selective CF2 miRNAs was conducted using the software DIANA mirPath. miRNAs with similar patterns in targeting significant pathways clustered together (69 miRNAs). Strong correlation with the pathways assembled in metabolic, stem cell associated- and migration/inflammation processes was observed. Only pathways targeted by the selected miRNAs with a P-value < 0,01 (FDR corrected) were considered for the analysis
Fig. 7
Fig. 7
Analysis of CF proteome. The protein composition of the CFs defines their origin and potential activity. (a) Quantification of the total proteins isolated from EVs derived from different CFs, demonstrating an enrichment of isolated proteins/EV in CF3 in respect to the other CFs. Data are expressed as means ±SEM (ng protein/EV) of four different experiments. ANOVA with Turkey’s multicomparison test. *P < 0.05 vs CF1. (b) Panther pathway analysis on the CF proteome shows abundance of interleukin, inflammation, TGF-β, gonadotropin release hormone receptor, angiogenesis and Wnt signaling pathways. (c) Distribution of the 413 proteins compartmentalized in all the CFs in different protein classes. The CF proteome contained the following class of proteins: signaling molecules, receptors, defense/immunity proteins, enzymes and cell adhesion molecules. d David GO-BB overrepresented by the CF proteome (P < 0,001; FDR 1%). The top ten processes were associated with regulation of cell proliferation, response to wounding, enzyme linked receptor protein signaling pathway, inflammatory response, receptor linked signal transduction, immune response, and regulation of phosphorylation
Fig. 8
Fig. 8
Differential expression analysis of proteins in EVs from different CF fractions. a David GO-MF terms over-represented by the proteins upregulated in the medium density CF2 in respect to the CF3 high density fraction (n = 75, FC CF2 > 1.5, outer chart). The same analysis was conducted for proteins upregulated in CF2 in respect to the low-density fraction CF1 (n = 92, FC CF2 > 1.5, inner chart). (B-C) Distribution analysis of the proteins enriched in CF2 in respect to CF3 b and to CF1 c, in different biological processes (GO-BB). The main representative classes were: signal transduction via receptor interaction, cell proliferation, response to wounding, cell-cell signaling and inflammatory response. (P-value < 0,01, FDR 1%)

References

    1. Ratajczak J, Miekus K, Kucia M, et al. Embryonic stem cell-derived microvesicles reprogram hematopoietic progenitors: evidence for horizontal transfer of mRNA and protein delivery. Leukemia. 2006;20(5):847–856. doi: 10.1038/sj.leu.2404132. - DOI - PubMed
    1. Bruno S, Grange C, Deregibus MC, et al. Mesenchymal stem cell-derived microvesicles protect against acute tubular injury. Journal of the American Society of Nephrology. 2009;20(5):1053–1067. doi: 10.1681/ASN.2008070798. - DOI - PMC - PubMed
    1. Tan CY, Lai RC, Wong W, Dan YY, Lim SK, Ho HK. Mesenchymal stem cell-derived exosomes promote hepatic regeneration in drug-induced liver injury models. Stem Cell Research & Therapy. 2014;5(3):76–89. doi: 10.1186/scrt465. - DOI - PMC - PubMed
    1. Zhu YJ, Sun J, Du T. Microvesicles derived from human umbilical cord mesenchymal stem cells facilitate tubular epithelial cell dedifferentiation and growth via hepatocyte growth factor induction. PloS One. 2015;10(3):e0121534. doi: 10.1371/journal.pone.0121534. - DOI - PMC - PubMed
    1. Nakamura Y, Miyaki S, Ishitobi H, et al. Mesenchymal-stem-cell-derived exosomes accelerate skeletal muscle regeneration. FEBS Letters. 2015;589(11):1257–1265. doi: 10.1016/j.febslet.2015.03.031. - DOI - PubMed

MeSH terms