

Role of testosterone and Y chromosome genes for the masculinization of the human brain
- PMID: 28070912
- PMCID: PMC6867124
- DOI: 10.1002/hbm.23483
Role of testosterone and Y chromosome genes for the masculinization of the human brain
Abstract
Women with complete androgen insensitivity syndrome (CAIS) have a male (46,XY) karyotype but no functional androgen receptors. Their condition, therefore, offers a unique model for studying testosterone effects on cerebral sex dimorphism. We present MRI data from 16 women with CAIS and 32 male (46,XY) and 32 female (46,XX) controls.
Methods: FreeSurfer software was employed to measure cortical thickness and subcortical structural volumes. Axonal connections, indexed by fractional anisotropy, (FA) were measured with diffusion tensor imaging, and functional connectivity with resting state fMRI.
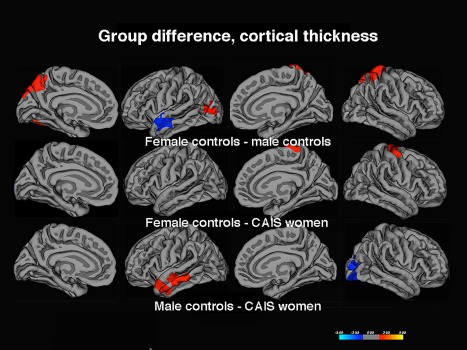
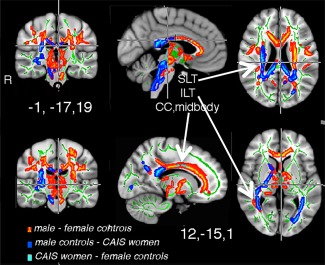
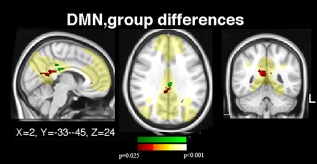
Results: Compared to men, CAIS women displayed a "female" pattern by having thicker parietal and occipital cortices, lower FA values in the right corticospinal, superior and inferior longitudinal tracts, and corpus callosum. Their functional connectivity from the amygdala to the medial prefrontal cortex, was stronger and amygdala-connections to the motor cortex weaker than in control men. CAIS and control women also showed stronger posterior cingulate and precuneus connections in the default mode network. Thickness of the motor cortex, the caudate volume, and the FA in the callosal body followed, however, a "male" pattern.
Conclusion: Altogether, these data suggest that testosterone modulates the microstructure of somatosensory and visual cortices and their axonal connections to the frontal cortex. Testosterone also influenced functional connections from the amygdala, whereas the motor cortex could, in agreement with our previous reports, be moderated by processes linked to X-chromosome gene dosage. These data raise the question about other genetic factors masculinizing the human brain than the SRY gene and testosterone. Hum Brain Mapp 38:1801-1814, 2017. © 2017 Wiley Periodicals, Inc.
Keywords: MRI; Y-chromosome; disorders of sexual differentiation; gender.
© 2017 Wiley Periodicals, Inc.
Figures
References
-
- Abdelgadir SE, Roselli CE, Choate JV, Resko JA (1999): Androgen receptor messenger ribonucleic acid in brains and pituitaries of male rhesus monkeys: studies on distribution, hormonal control, and relationship to luteinizing hormone secretion. Biol Reprod 60:1251–1256. - PubMed
-
- Basser PJ, Jones DK (2002): Diffusion‐tensor MRI: Theory, experimental design and data analysis ‐ a technical review. NMR Biomed 15:456–467. - PubMed
-
- Beckmann CF, Smith SM (2004): Probabilistic independent component analysis for functional magnetic resonance imaging. IEEE Trans Med Imaging 23:137–152. - PubMed
Publication types
MeSH terms
Substances
LinkOut - more resources
Full Text Sources
Other Literature Sources
