. 2017 Jan 10:8:13991.
doi: 10.1038/ncomms13991.

Neuronal sFlt1 and Vegfaa determine venous sprouting and spinal cord vascularization

Affiliations

Neuronal sFlt1 and Vegfaa determine venous sprouting and spinal cord vascularization

Raphael Wild et al. Nat Commun. .

Abstract

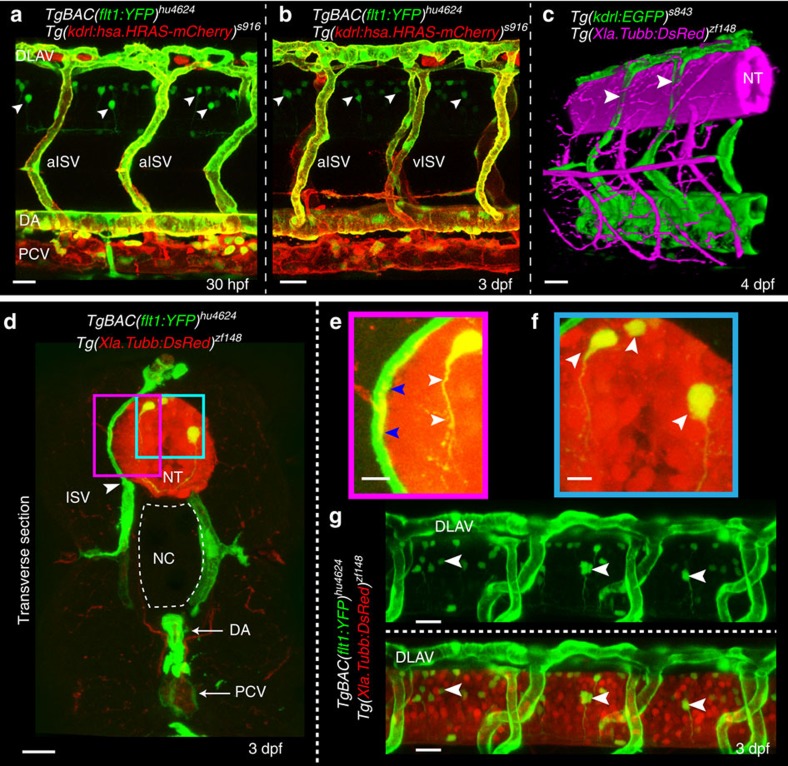
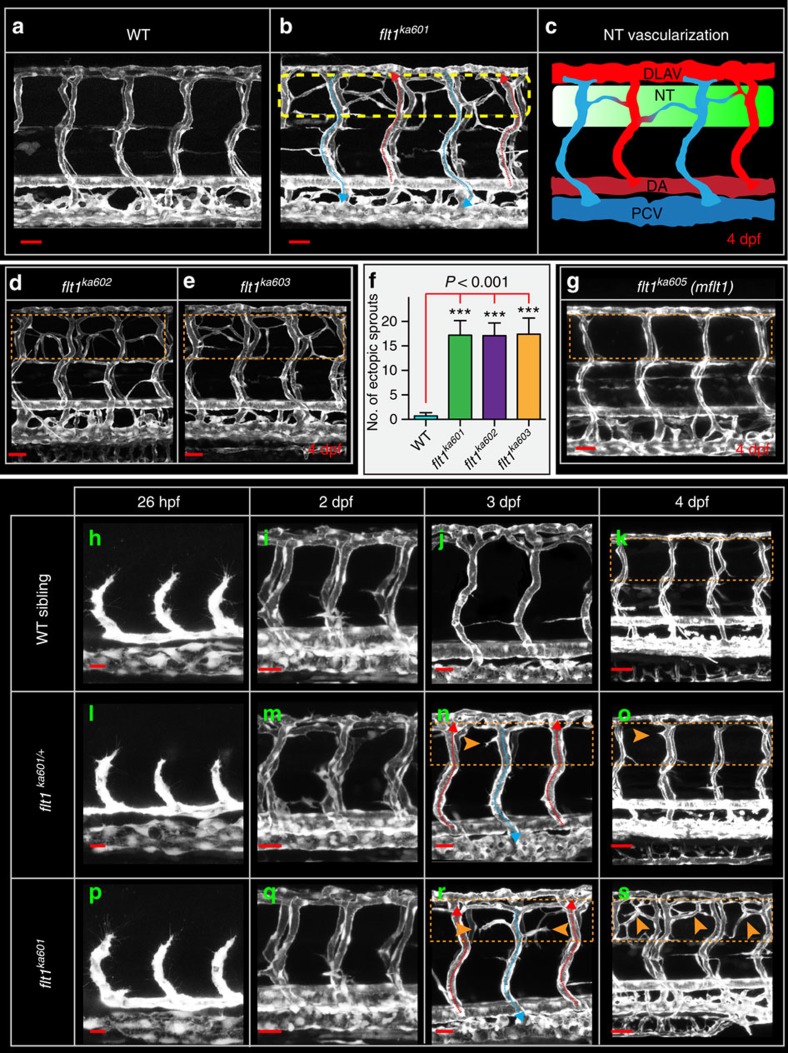
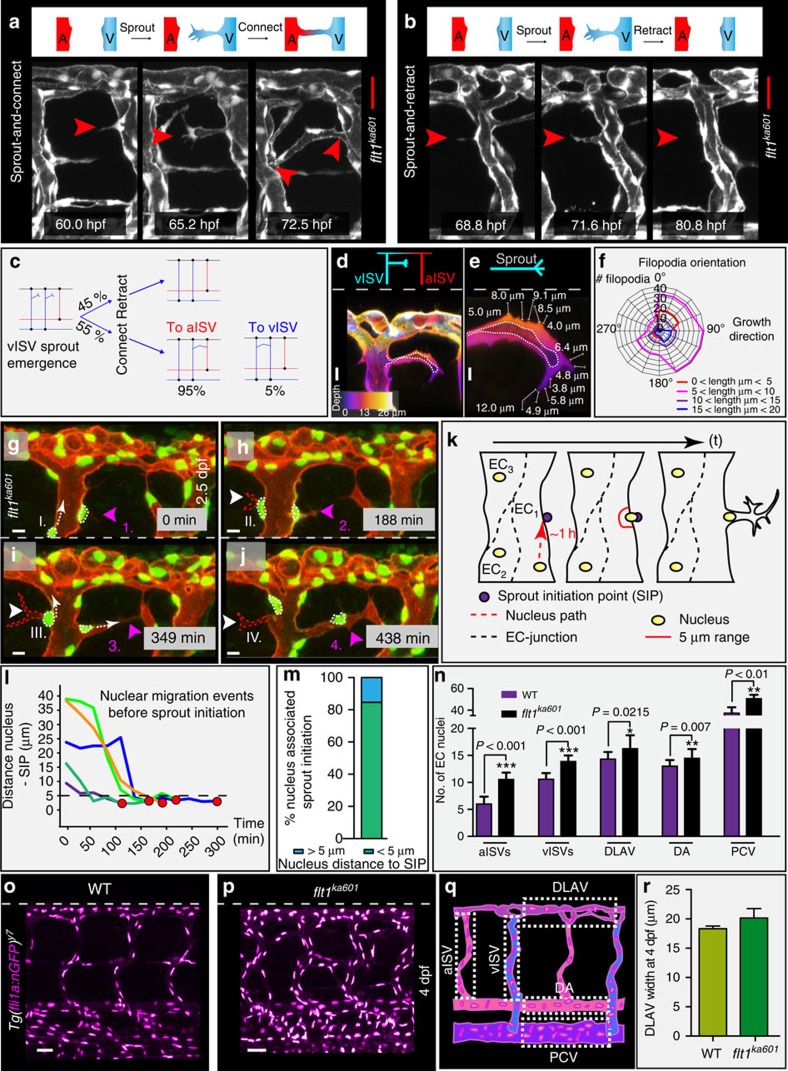
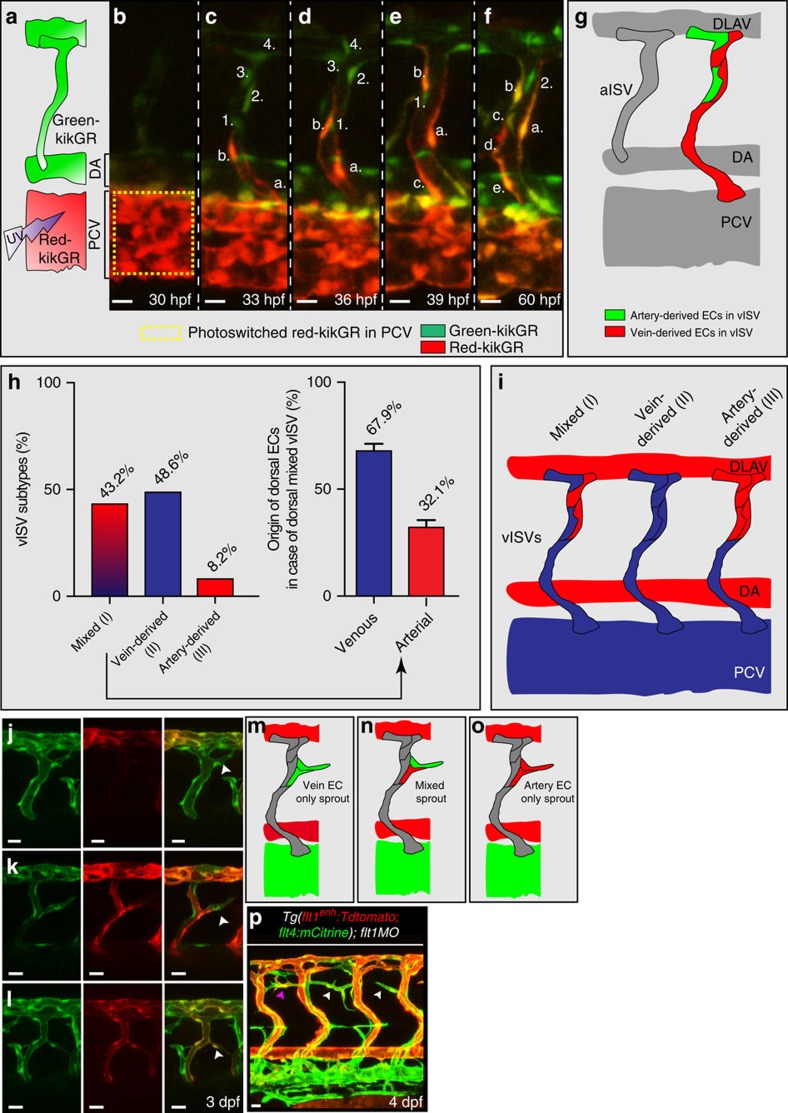
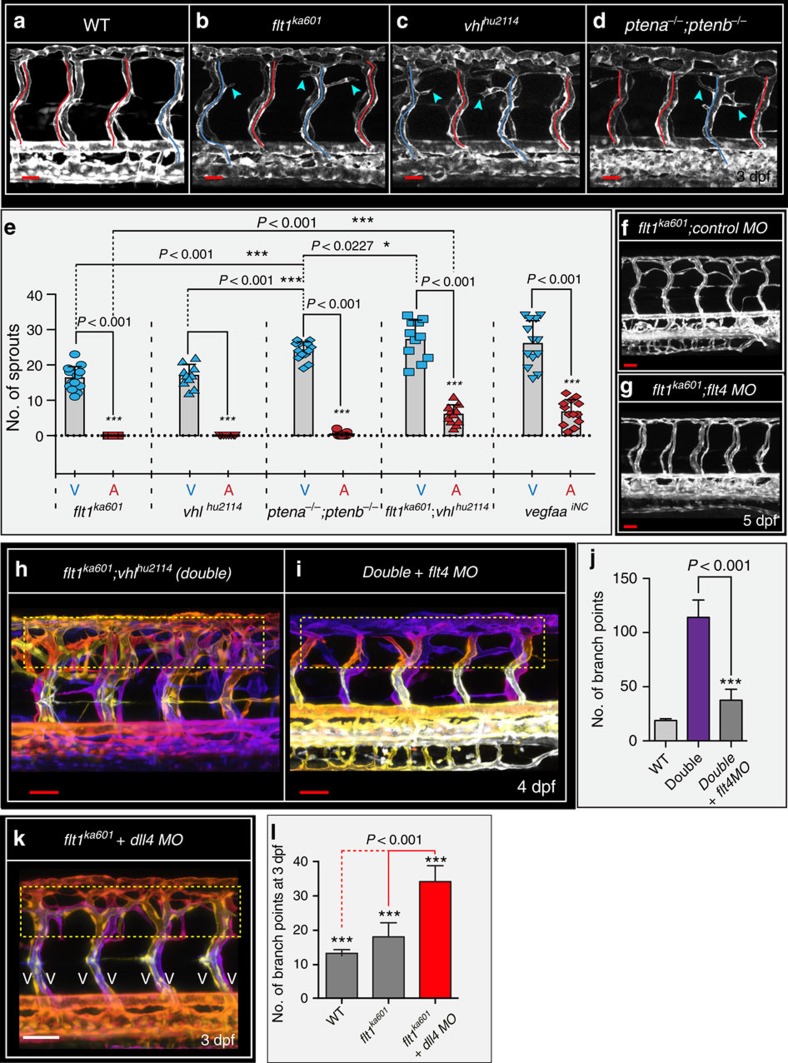
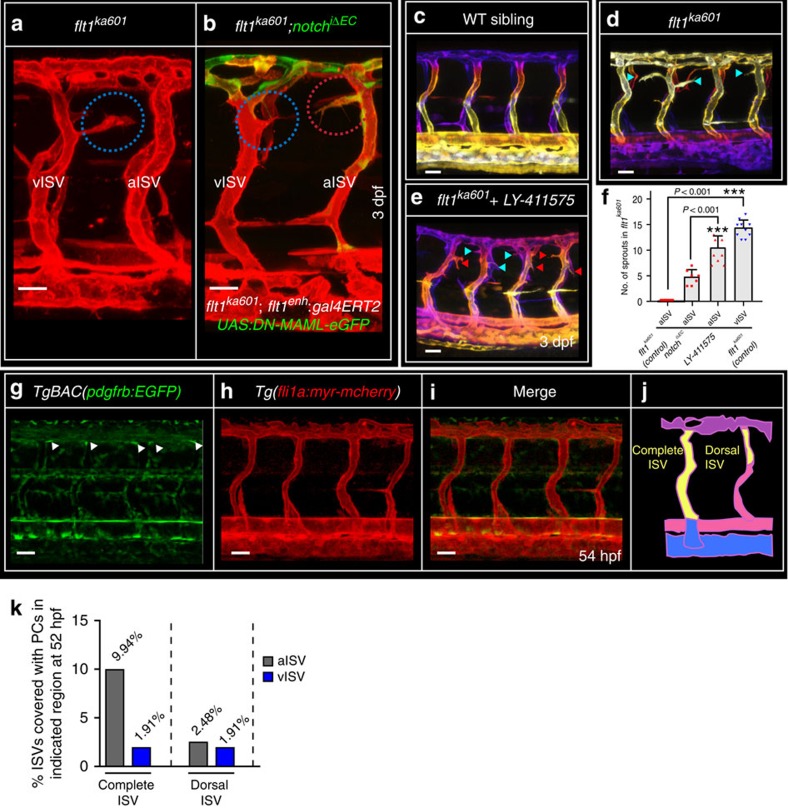
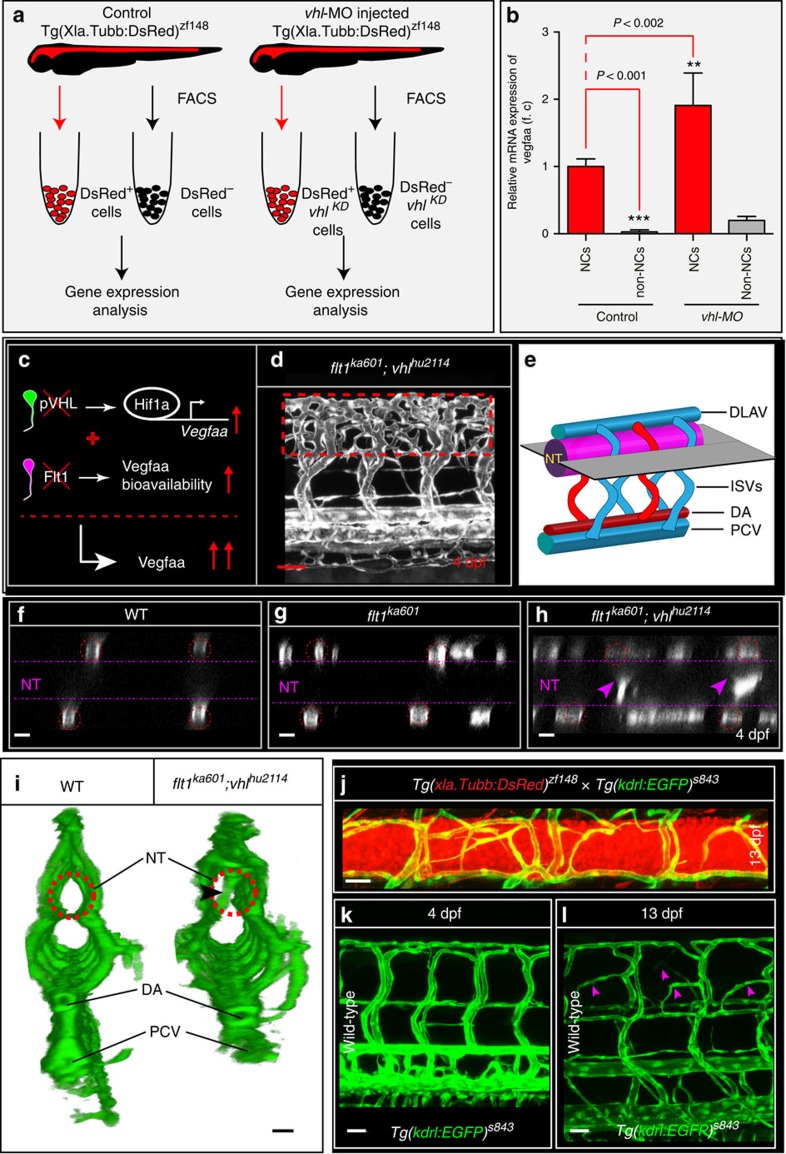
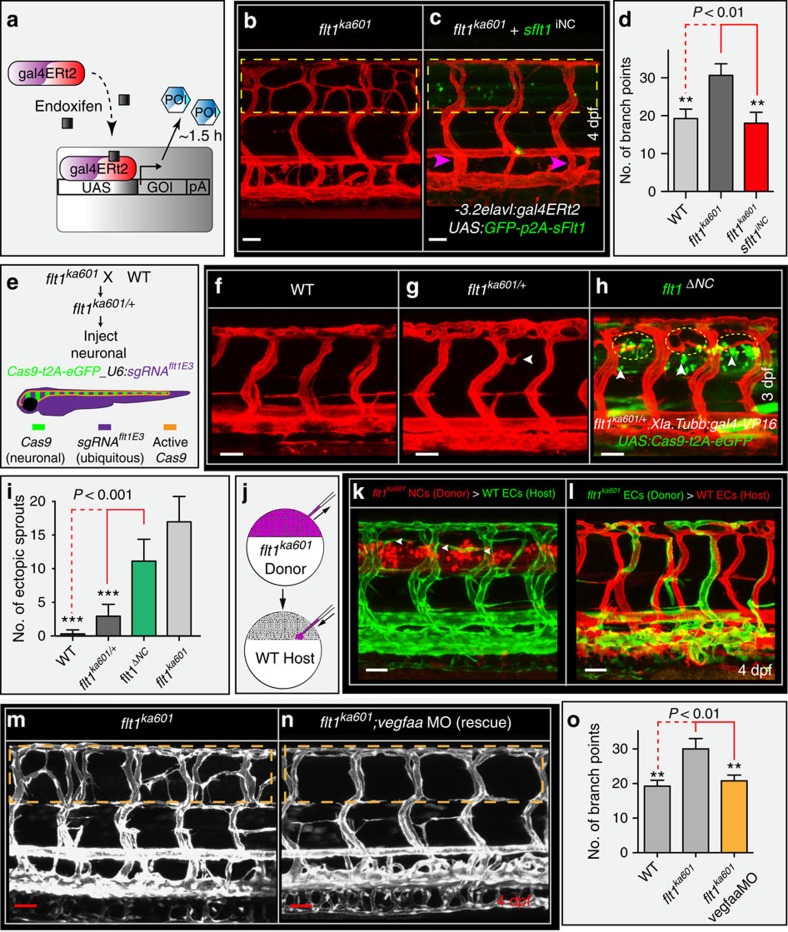
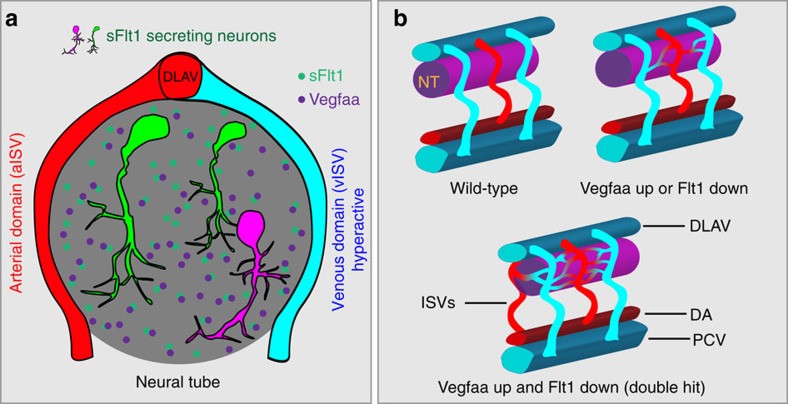
Formation of organ-specific vasculatures requires cross-talk between developing tissue and specialized endothelial cells. Here we show how developing zebrafish spinal cord neurons coordinate vessel growth through balancing of neuron-derived Vegfaa, with neuronal sFlt1 restricting Vegfaa-Kdrl mediated angiogenesis at the neurovascular interface. Neuron-specific loss of flt1 or increased neuronal vegfaa expression promotes angiogenesis and peri-neural tube vascular network formation. Combining loss of neuronal flt1 with gain of vegfaa promotes sprout invasion into the neural tube. On loss of neuronal flt1, ectopic sprouts emanate from veins involving special angiogenic cell behaviours including nuclear positioning and a molecular signature distinct from primary arterial or secondary venous sprouting. Manipulation of arteriovenous identity or Notch signalling established that ectopic sprouting in flt1 mutants requires venous endothelium. Conceptually, our data suggest that spinal cord vascularization proceeds from veins involving two-tiered regulation of neuronal sFlt1 and Vegfaa via a novel sprouting mode.


Figures

Figure 1
Figure 1. Expression of Vegf receptors and ligands at the neurovascular interface.
(a,b) Double transgenic embryos TgBAC(flt1:YFP)hu4624; Tg(kdrl:hsa.HRAS-mcherry)916 at 30 hpf and 3 dpf shows flt1 expression (green) in dorsal aorta, arterial ISV and dorsal aspect of venous ISV (3 dpf) and neurons (arrowheads). (c) 3D-rendered view of vessels (green) and nerves (purple) in Tg(kdrl:EGFP)s843;Tg(XIa.Tubb:DsRed)zf148 embryos highlighting dorsal aspect of ISVs (arrowheads) in close contact to the neural tube (NT). (d) Transverse section of the trunk of TgBAC(flt1:YFP)hu4624;Tg(XIa.Tubb:DsRed)zf148 embryos shows that ISVs (green, arrowhead) and neural tube (NT, red) are in close contact. Dorsal is up. (e) Magnified view of purple-boxed area in (d), showing direct contact of vessels with nerves at the neurovascular interface (blue arrowheads) and flt1 expressing neurons with long axonal extensions in the neural tube (white arrowheads). (f) Magnified view of blue-boxed area in (d) showing flt1 expressing neurons (arrowheads) and their axons inside neural tube (red). (g) Lateral view of TgBAC(flt1:YFP)hu4624; Tg(Xla.Tubb:DsRed)zf148 at the level of the neural tube showing flt1 expressing neurons (arrowheads) in neural tube. DA, dorsal aorta; dpf, days post fertilization; DLAV, dorsal longitudinal anastomotic vessel; hpf, hours post fertilization; ISV, intersegmental vessel; NC, notochord; NT, neural tube; PCV, posterior cardinal vein. Scale bar, 30 μm in a–d,g; 10 μm in e,f.
Figure 2
Figure 2. Flt1 mutants develop hyper-branched vascular networks at the level of the neural tube.
(a) Trunk vasculature in 4 dpf WT sibling, (b) trunk vasculature in 4 dpf flt1ka601 mutant, in Tg(kdrl:EGFP)s843 background. Perfused aISVs with red arrow, veins with blue arrow. Note the extensive amount of hyper-branching (dotted box) at the level of the neural tube. (c) Schematic representation of hyper-branching phenotype along the neural tube; ectopic vessels make anastomosis between vISV (blue) with aISVs (red). (d) Hyper-branching (dotted box) is also observed in flt1ka602 and (e) flt1ka603 mutants. (f) Quantification of hyper-branching for indicated mutant alleles. Mean±s.e.m., n=10 per group, ANOVA. (g) Membrane-bound flt1 mutant (flt1ka605) without vascular phenotype (compare dotted box in g, with control in a). (hk) Trunk vascular network in WT embryos at indicated time points. (lo) Trunk vasculature in flt1ka601 /+ embryos at indicated time points. (ps) Trunk vasculature in flt1ka601 embryos at indicated time points. Arrowheads indicate ectopic branches. DA, dorsal aorta; PCV, posterior cardinal vein; DLAV, dorsal longitudinal anastomotic vessel; NT, neural tube; hpf, hours post fertilization; dpf, days post fertilization. Scale bar, 50 μm in a,b,d,e,g,i,m,q,k,o,s; 25 μm in h,l,p,j,n,r.
Figure 3
Figure 3. Imaging and quantification of sprouting kinetics in flt1ka601 mutants.
(a) Time lapse imaging of sprout initiation and anastomosis formation in flt1ka601 mutant. Sprout initiation (60.0 hpf), elongation (65.2 hpf) and connection-anastomoses (72.5 hpf) with adjacent aISV. (b) Time lapse imaging of sprout initiation and retraction in flt1ka601 mutant. Endothelial cells produce filopodia (68.8 hpf), extend a sprout (71.6 hpf), which subsequently retracts (80.8 hpf). (c) Quantification of data in (a,b) showing % of sprouts retracting (top part, 45%) or connecting (bottom part, 55%) to adjacent ISVs. In the latter scenario sprouts in 95% of cases connected to aISV (red) and in 5% of cases to vISV (blue). Angiogenic behaviour was analysed in time-lapse confocal movies, n=20 embryos. (df) Filopodia directionality and length in flt1ka601 mutants (n=10 embryos, n=920 filopodia). (gj) Time lapse imaging of endothelial nuclei in Tg(fli1a:nGFP)y7; Tg(kdrl:hsa.HRAS-mcherry)s916 showing association between nuclear position and sprouting initiation point (SIP). Note that sprouts arise in close proximity to the position of the nucleus. Arrowheads indicate sprouts; nuclei at indicated time points (sprout initiation with actively migrating nucleus towards SIP I, II, III, IV and nucleus already located at SIP 1,2,3,4). (k) Schematic representation of nuclear position with respect to SIP. (l,m) Quantification of observations in gj. Red dot indicates sprout initiation time point. Note that sprouting preferentially occurs when endothelial nuclei are within less than 5 μm from SIP (SIP below dotted line in (l)). n=5 (l) and n=13 (m). (nq) Quantification of EC nuclei in aISV, vISVs, DLAV, DA and PCV of WT and flt1ka601 embryos at 4 dpf; mean±s.e.m., t-test, n=21 embryos per genotype. (r) Quantification of DLAV width in WT and flt1ka601 mutant, n=9 embryos per genotype. A, artery; aISV, arterial intersegmental vessel; DA, dorsal aorta; DLAV, dorsal longitudinal anastomotic vessel; EC, endothelial cell; PCV, posterior cardinal vein; SIP, sprout initiation point; V, vein; vISV, venous intersegmental vessel. Scale bar, 30 μm in a,b; 10 μm in d,e,gj; 50 μm in o,p.
Figure 4
Figure 4. Arterial and venous-derived endothelial cells populate the dorsal part of venous ISV and contribute to sprouting upon loss of flt1.
(a) Endothelial cell tracking in Tg(kdrl:nlsKikGR)hsc7 embryos. Photo-converted PCV-derived venous endothelial cells express red-kikGR. (bf) Endothelial cell tracing during 30–60 hpf, showed that PCV-derived endothelium, indicated in red & labelled a,b,c,d,e, migrated along the ISV, from ventral to dorsal up to the most dorsal part of vISVs (cell labelled b). Pre-existing arterial endothelial cells in ISV, in green and labelled 1,2,3,4, shows artery-derived ECs in the dorsal part of vISVs (cell labelled 2) adjacent of PCV-derived EC (cell labelled b,a). (g) Schematic representation of the scenario imaged in bf. (h) Left panel: Identity analysis of endothelial cells in the dorsal part of vISV revealed three different scenarios: (I) mixed, both arterial and venous-derived endothelium were present, (II) only vein-derived endothelium, (III) only artery-derived endothelium. (n=10 experiments & 6ISVs/embryo). Right panel: % of artery and vein-derived endothelium in the mixed population scenario. (i) Schematic representation of the three identity scenarios in dorsal part of vISV. Arterial derived EC in red, venous-derived EC in blue. (jl) Ectopic sprouting scenarios in flt1 morphants in Tg(flt1enh:Tdtomato; flt4:mCitrine), n=6 embryos. (j) Ectopic venous sprout devoid of flt1enh expressing artery-derived EC (arrowhead). (k) Ectopic venous sprout (arrowhead) containing both arterial and venous-derived ECs; the flt1enh expressing artery-derived EC is juxtaposed to the venous-derived cell at the tip (arrowhead). (l) Ectopic venous sprout only containing flt1enh expressing artery-derived ECs; flt1enh (red) and flt4 (green) were expressed by the same cell which appears in yellow (arrowhead). (mo) Schematic representation of the three ectopic venous sprouting scenarios. (p) Ectopic sprouting upon loss of flt1 in Tg(flt1enh:Tdtomato; flt4:mCitrine) (representative of 5 embryos). Flt1enh positive sprouts (pink arrowhead) and sprouts devoid of flt1enh (white arrowhead). MO, flt1 morpholino, 1ng. aISV, arterial intersegmental vessel; DA, dorsal aorta; DLAV, dorsal longitudinal anastomotic vessel; PCV, posterior cardinal vein; vISV, venous intersegmental vessel. Scale bar, 20 μm in jl, 10 μm in bf,p.
Figure 5
Figure 5. flt1ka601 mutants and vegfaa gain-of-function scenarios promote ectopic venous sprouting.
(ad). Trunk vasculature at 3 dpf in WT (a), flt1ka601 (b), vhlhu2114 (c) and ptena−/−;ptenb−/− double mutants (d) in Tg(kdrl:EGFP)s843 background. Note ectopic sprouts originate from vISVs (blue arrowheads) in mutants. aISVs indicated in red, vISVs in blue. (e) Quantification of ectopic sprouting in indicated mutants and inducible neuronal-specific vegfaa gain-of-function. In all models ectopic sprouting preferentially occurs in veins, mean±s.e.m., n=10-13/per group, t-test. (f,g) flt1ka601 mutants show hyper-branching and knockdown of flt4 in flt1ka601 mutant rescues hyper-branching; n=21 embryos per group. (h,i) Knockdown of flt4 in flt1ka601; vhlhu2114 double mutants (double) rescues hyper-branching; compare yellow dotted box in h,i. The position of vessels is colour-coded. Note: on loss of flt4 the trunk vasculature consists almost exclusively of aISV. (j) Quantification of h,i. Mean±s.e.m., n=12 embryos per group, t-test. (k,l) Loss of dll4 in flt1ka601 mutants augments ectopic branching compared with untreated flt1ka601 mutants. Note: on loss of dll4 the trunk vasculature consists almost exclusively of vISV; n=11 embryos per group, t-test. aISV, intersegmental artery; MO, morpholino; vISV, intersegmental vein. Scale bar, 30 μm in ad,f; 50 μm in fi,k.
Figure 6
Figure 6. Notch inhibits ectopic arterial sprouting in flt1ka601 mutants.
(a), flt1ka601 mutants show ectopic venous sprouts (blue circles), but no arterial sprouts. (b) Inhibiting arterial Notch by endoxifen-induced arterial ISV-specific expression of dominant negative MAML-eGFP (Notch iΔEC) at 52 hpf under control of the flt1enh promoter in flt1ka601 mutant results in the emergence of ectopic arterial sprouts (red circles); representative image from 7 experiments. (ce) Trunk vasculature of WT (c), flt1ka601(d) and flt1ka601 treated with Notch inhibitor LY-411575 (e). LY-411575 was added at 2 dpf. Note the emergence of ectopic arterial sprouts upon LY-411575 treatment. (red arrowhead: arterial sprout; blue arrowhead: venous sprout). (f) Quantification of experiments in (ae), mean±s.e.m., n=7 for NotchiΔEC, n=10 for LY-41157 treatment, n=10 for flt1ka601; t-test. (gi) Imaging of pericytes in TgBAC(pdgfrb:EGFP);Tg(fli1a:myr-mcherry) double transgenic at 54 hpf. (j) Schematic representation of pericyte number counting in ISVs as performed in (k). (k) Quantification of pericyte recruitment in aISVs and vISVs at 54 hpf. (n=246 ISVs from 14 embryos). ISV, intersegmental artery; Notch iΔEC, inducible ISV-specific loss of Notch; vISV, intersegmental veina. Scale bar, 25 μm in ae,gi.
Figure 7
Figure 7. Neurons are a major source of Vegfaa and attract sprouting vessels.
(a) FACS procedure for obtaining neuronal cells in control and vhl morphants using Tg(Xla.Tubb:DsRed)zf148 neuronal reporter embryos. (b) Quantification of vegfaa expression using real-time qPCR in FAC-sorted cell populations at 3 dpf. Note that neuronal cells expressed significantly more vegfaa than non-neuronal cells. Loss of vhl promoted neuronal vegfaa expression. Mean±s.e.m., n=3 separate experiments in triplicate (two-way ANOVA). (c) Schematic representation: loss of vhl augments vegfaa transcription, loss of flt1 augments Vegfaa bioavailability; combining both mutants augments Vegfaa bioavailability above single mutant level. (d) Trunk vasculature in flt1ka601;vhlhu2114 double mutants at 4 dpf. Note the severe hyper-branching at the level of the neural tube, red-dotted box. (e) Schematic representation of optical section (shown in fh) through the neural tube and associated trunk vasculature. (fh) Dorsal view on optical section through WT (f), flt1ka601 (g) and flt1ka601;vhlhu2114 double mutants (h). Note invasion of sprouts into the neural tube in double mutants (arrowheads in h). Red circle indicates position of ISVs, dotted line neural tube boundary. (i) Transverse 3D-rendered view of vasculature (green) through the trunk in WT (left panel) and flt1ka601;vhlhu2114 double mutants (right panel); note vessels penetrating the neural tube in mutant (compare vessel in dotted circle right panel, arrowhead; such vessels are absent in WT left panel; representative image from 3 separate experiments). (j) Representative image of spinal cord vascular network in Tg(xIa.Tubb:DsRed)zf148; Tg(kdrl:EGFP)s843 double transgenic at 13 dpf. (k,l) Comparison of trunk vasculature in WT at 4 dpf (k) and at 13 dpf (l); note the emergence of ectopic branches (pink arrowheads) at level of the spinal cord. DA, dorsal aorta; f.c. fold change; KD, knockdown; NT, neural tube; NC, neuronal cell; PCV, posterior cardinal vein. Mutants are in Tg(kdrl:EGFP)s843 background. Scale bar, 50 μm in d; 25 μm in fl.
Figure 8
Figure 8. Neuronal Flt1 regulates vascular branching by titrating neuronal Vegfaa.
(a) Schematic representation of endoxifen inducible gain-of-function approach in zebrafish. In the present situation Gal4 is under the control of neuron-specific promoters elavl or XIa.Tubb. Expression can be observed within 1.5 h upon endoxifen application. (b) Hyper-branching in flt1ka601 mutants (dotted box). (c) Endoxifen inducible neuron-specific sflt1 gain-of-function rescues hyper-branching in flt1ka601 mutants; compare dotted box in c and b. Purple arrowheads indicate vISVs; endoxifen was applied at 52 hpf. (d) Quantification of rescue in (b,c), mean±s.e.m, n=15-19 embryos per group. (e) Approach for generating a neuron-specific flt1 mutant. Cas9 was expressed under control of neuronal promoter Xla.Tubb; sgRNA was expressed ubiquitously, resulting in Cas9 activity in neuronal cells only (domain marked by orange border). Heterzygous flt1ka601/+ were used to facilitate biallelic knockout. (fh) Neuron-specific loss of flt1 (flt1ΔNC) induces ectopic sprouting (h), sprouts in yellow dotted ellipse, arrowheads indicate neuronal cells with Cas9 expression. (i) Quantification of ectopic sprouting for indicated genotypes. Note that neuron-specific loss of flt1 significantly augments ectopic sprouting (green bar) mean±s.e.m, n=16 embryos per group, t-test. (jl) Transplantation of flt1 mutant neuronal cells (k) and endothelial cells (l) into WT. Note: transplantation of flt1 mutant neuronal cells induced sprouting (k, arrowheads); 9 out of 12 neuronal cell transplantations resulted in sprout formation. In all 10 endothelial cell transplantations, sprouts were absent (l). (m,n) Low dose morpholino-mediated reduction of vegfaa expression in flt1ka601 mutants rescues sprouting defects; compare dotted box in (m,n). (o) Quantification of rescue in (m,n), mean±s.e.m., n>5 per group, t-test. DA, dorsal aorta; PCV, posterior cardinal vein; DLAV, dorsal longitudinal anastomotic vessel; NT, neural tube. GOI, gene of interest; POI, protein of interest; iNC, inducible, neuronal cell specific gain-of-function; ΔNC, neuron-specific loss of flt1; MO, morpholino. Scale bar, 50 μm in bh,m,n; 25 μm in k,l.
Figure 9
Figure 9. Schematic representation of neurovascular communication involving neuronal sFlt1-Vegfaa and sprouting from intersegmental veins.
(a) Spinal cord neurons produce both sFlt1 and Vegfaa in close proximity to the dorsal aspect of intersegmental arteries and veins. (b) Schematic representation of vascularization around the neural tube in WT (top left), flt1ka601 single mutant or vhlhu2114 single mutant (top right), and flt1ka601;vhlhu2114 double mutant (bottom). Loss of flt1 or vhl induces the formation of a peri-neural tube network, and combining both mutants in addition promotes sprouting into the neural tube. NT, neural tube; ISV, intersegmental vessel (a-arterial, v-venous); DA, dorsal aorta; PCV, posterior cardinal vein; DLAV, dorsal longitudinal anastomotic vessel; hpf, hours post fertilization.

References

    1. Zacchigna S., Lambrechts D. & Carmeliet P. Neurovascular signalling defects in neurodegeneration. Nat. Rev. Neurosci. 9, 169–181 (2008). - PubMed
    1. White I. A., Gordon J., Balkan W. & Hare J. M. Sympathetic reinnervation is required for mammalian cardiac regeneration. Circ. Res. 117, 990–994 (2015). - PMC - PubMed
    1. Nam J. et al.. Coronary veins determine the pattern of sympathetic innervation in the developing heart. Development 140, 1475–1485 (2013). - PMC - PubMed
    1. Eichmann A., Le Noble F., Autiero M. & Carmeliet P. Guidance of vascular and neural network formation. Curr. Opin. Neurobiol. 15, 108–115 (2005). - PubMed
    1. Larrivee B., Freitas C., Suchting S., Brunet I. & Eichmann A. Guidance of vascular development: Lessons from the nervous system. Circ. Res. 104, 428–441 (2009). - PubMed

Publication types

MeSH terms