. 2017 Jan 10:8:13978.
doi: 10.1038/ncomms13978.

PhotoGate microscopy to track single molecules in crowded environments

Affiliations

PhotoGate microscopy to track single molecules in crowded environments

Vladislav Belyy et al. Nat Commun. .

Abstract

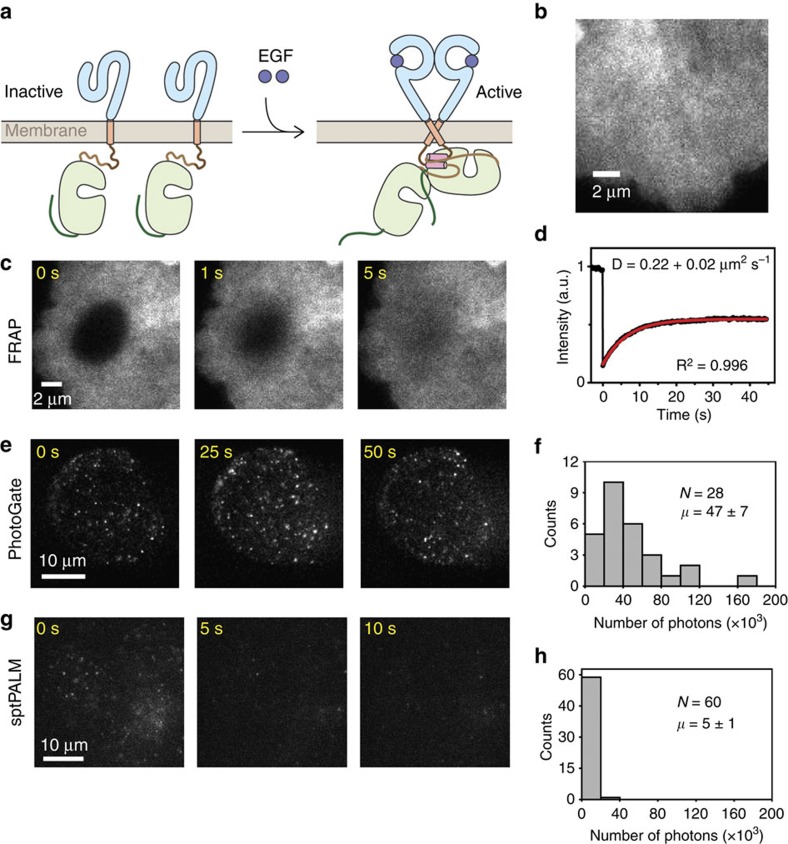
Tracking single molecules inside cells reveals the dynamics of biological processes, including receptor trafficking, signalling and cargo transport. However, individual molecules often cannot be resolved inside cells due to their high density. Here we develop the PhotoGate technique that controls the number of fluorescent particles in a region of interest by repeatedly photobleaching its boundary. PhotoGate bypasses the requirement of photoactivation to track single particles at surface densities two orders of magnitude greater than the single-molecule detection limit. Using this method, we observe ligand-induced dimerization of a receptor tyrosine kinase at the cell surface and directly measure binding and dissociation of signalling molecules from early endosomes in a dense cytoplasm with single-molecule resolution. We additionally develop a numerical simulation suite for rapid quantitative optimization of Photogate experimental conditions. PhotoGate yields longer tracking times and more accurate measurements of complex stoichiometry than existing single-molecule imaging methods.


Figures

Figure 1
Figure 1. PhotoGate imaging for single-particle tracking
(a) 2D PhotoGate schematic (top row) with corresponding representative images (bottom row). (1) A cell surface is heavily decorated with fluorescently labelled molecules (blue circles). (2–3) The focused gate beam is swept outwards from the centre in a spiral pattern to pre-bleach an elliptical region. (4) The gate beam is turned off to allow diffusion of fluorescent molecules from the periphery of the ROI, which are then imaged under TIRF illumination (yellow circles). (5) The gate beam is repeatedly turned on to photobleach fluorescent particles entering the ROI (dark blue circles) while single molecules inside the ROI are imaged under TIRF illumination. Photobleached particles are not shown for clarity. (b) Linear intensity profile along a line bisecting the PhotoGate ring shown in a. (c) A coverslip densely coated with GFP is bleached with a single sweep of the PhotoGate ring to demonstrate the bleaching profile (d) The bleaching profile plotted along the black dashed line in c.
Figure 2
Figure 2. Measuring APPL1 residence times on early endosomes.
(a) A model for the exchange of fluorescent APPL1–GFP with bleached APPL1 molecules on an endosome. (b) (Left) image of a U2OS cell expressing APPL1–GFP under TIRF excitation. A 17 μm diameter area in the cytoplasm was photobleached at t=0 s (middle), and recovery of GFP-APPL1 fluorescence within the bleached area was recorded using FRAP (right). (c) A typical FRAP curve of a single cell, measured at a single endosome after bleaching a 10 μm diameter region. The red curve represents a single exponential fit to the fluorescence recovery data (mean±95% confidence interval). (d) Recovery lifetimes, measured at endosomes and endosome-free regions of the cytoplasm. The line within the boxplot represents the median. The outer edges of the box are the 25th and 75th percentiles. The whiskers extend to the minimum and maximum values. N=10 cells for each condition. (e) Image of an APPL1–GFP U2OS cell in the middle of a PhotoGate experiment. The yellow square represents the appearance of a single APPL1 molecule at a previously determined endosomal location in the ROI. (f) Fluorescence intensity trajectories of single spots inside the ROI reveal the arrivals and departures of single APPL1 molecules. (Top) enlarged snap shots at different time points of the fluorescent spot marked with a yellow square in e. (g) Residence times of single APPL1 molecules are fitted with a single exponential decay to obtain the average lifetime (mean and 95% confidence interval).
Figure 3
Figure 3. Tracking of single EGFR molecules in a live cell membrane
(a) A model for the ligand-induced dimerization of EGFR. EGFR monomer contains an extracellular ligand-binding region (blue), a single-transmembrane helix, an intracellular tyrosine kinase domain (light yellow) and a C-terminal tail. Binding of EGF ligands to the extracellular domain induces an asymmetric dimer formation. (b) mNeonGreen-EGFR molecules densely cover COS7 cell membrane. (c) mNeonGren-EGFR molecules exhibit a continuous recovery of fluorescent intensity in a FRAP assay. (d) The fit of fluorescence recovery signal (red curve) reveals the average diffusion constant of EGFR spots. (e) In PhotoGate, diffusion of single mNeonGreen-EGFR molecules was tracked in the ROI over 30 s. (f) On average, ∼47,000 photons were detected from single mNeonGreen molecules using PhotoGate (mean±s.e.m.). (g) In the sptPALM experiment, individual mEos2-EGFR molecules were photoactivated with 405 nm excitation at t=0 s, and fluorescent spots were tracked over 5 s. (h) The number of photons detected from single mEos2 spots before photobleaching (mean±s.e.m.) was nine times lower than that of mNeonGreen.
Figure 4
Figure 4. Ligand-induced dimerization of EGFR is determined by diffusion analysis and subunit counting.
(a) Sample trajectory of an individual GFP-EGFR spots diffusing on a COS7 cell membrane. (b) MSD plot of an example trajectory (mean±s.d.). The slope of the linear fit (red line) represents the diffusion constant. (c) Diffusion constant histogram of EGFR spots in the absence (top) and the presence of 16 nM EGF. Multiple Gaussian fit (black dotted curve) reveals two major peaks. Without EGF, 91% of the spots are at the more diffusive state (D=0.25±0.07 μm2 s−1, blue curve) and 9% at the less diffusive state (D=0.12±0.03 μm2 s−1, red curve). EGF addition results in the 75% of the spots shifting from the more diffusive to the less diffusive state. (d) Example intensity profiles of EGFR spots showing one- (top) and two-step (bottom) photobleaching. (e) Photobleaching step histograms of GFP-EGFR spots in the absence (top) and presence (bottom) of EGF. (f) The average diffusion constant of EGFR spots that photobleached in one- and two-steps with and without EGF (mean±s.e.m.).
Figure 5
Figure 5. Numerical simulations of PhotoGate experiment and comparison with TOCCSL.
(a) Durations of single-particle trajectories with D=0.1 μm2 s−1 with 0.5 Hz gating frequency (left) and particle trajectories with D=0.5 μm2 s−1 with 3 Hz gating frequency (right) in a simulated PhotoGate experiment, compared to equivalent TOCCSL experiments. (b) Numbers of single particle trajectories of a dimeric molecule with D=0.1 μm2 s−1 showing one- and two-step bleaching events over the course of an 80-second experiment in a single cell (mean±s.d.). (c) Fluorophore density in a 14 μm diameter ROI over the course of a PhotoGate (left) and TOCCSL experiment (right) as a function of photon flux of a single fluorophore per second. (d) Density of fluorophores inside a 14 μm ROI in typical TOCCSL and PhotoGate experiments (0.5 Hz gating frequency and 1,500 photons per s). (e) Density of fluorophores inside the ROI of a PhotoGate experiment 30 s after initial bleaching as a function of gating frequency. Data are shown for fluorophores with diffusion constants of 1 and 0.1 μm2 s−1. (f) Fluorophore density over the course of a PhotoGate (left) and TOCCSL (right) experiments as a function of ROI radius. Black arrow on the intensity scale and dotted lines in the heat maps point to approximate single-molecule detection limit (1 fluorescent spot μm−2). In all simulations, the average number of photons detected per fluorophore before photobleaching is 5 × 10⁵ photons, and surface density of fluorescent spots is 50 μm−2 at the beginning of the simulations. See Supplementary Tables 1–3 for a detailed list of the simulation parameters.

References

    1. Yildiz A. et al. Myosin V walks hand-over-hand: single fluorophore imaging with 1.5-nm localization. Science 300, 2061–2065 (2003). - PubMed
    1. Rust M. J., Bates M. & Zhuang X. Sub-diffraction-limit imaging by stochastic optical reconstruction microscopy (STORM). Nat. Methods 3, 793–795 (2006). - PMC - PubMed
    1. Betzig E. et al. Imaging intracellular fluorescent proteins at nanometer resolution. Science 313, 1642–1645 (2006). - PubMed
    1. Kner P., Chhun B. B., Griffis E. R., Winoto L. & Gustafsson M. G. Super-resolution video microscopy of live cells by structured illumination. Nat. Methods 6, 339–342 (2009). - PMC - PubMed
    1. Klar T. A., Jakobs S., Dyba M., Egner A. & Hell S. W. Fluorescence microscopy with diffraction resolution barrier broken by stimulated emission. Proc. Natl Acad. Sci. USA 97, 8206–8210 (2000). - PMC - PubMed

Publication types

MeSH terms