. 2017 Jan 10:7:40220.
doi: 10.1038/srep40220.

High fat diet-induced changes of mouse hepatic transcription and enhancer activity can be reversed by subsequent weight loss

Affiliations

High fat diet-induced changes of mouse hepatic transcription and enhancer activity can be reversed by subsequent weight loss

Majken Siersbæk et al. Sci Rep. .

Abstract

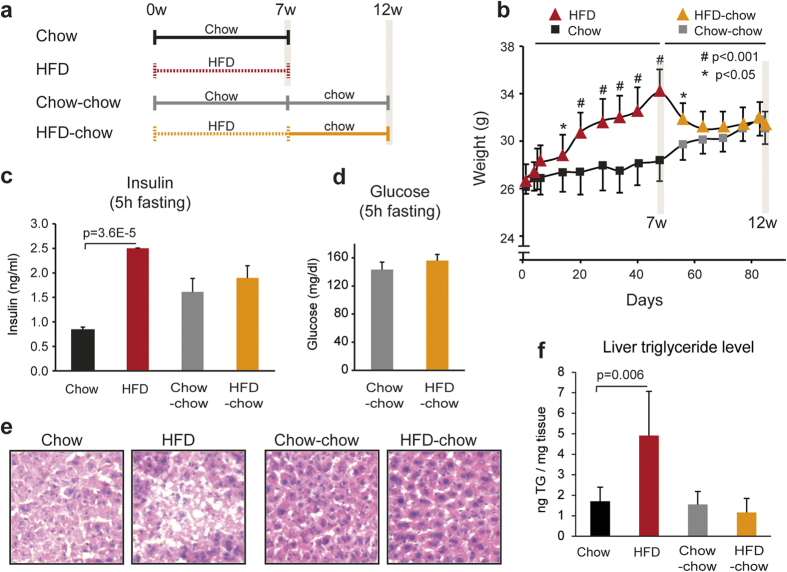
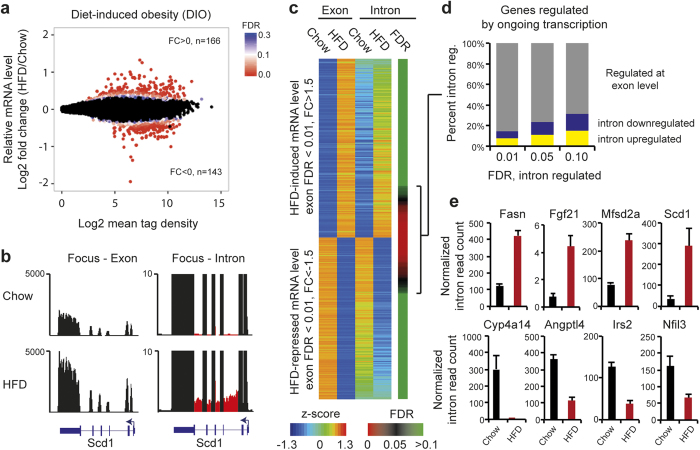
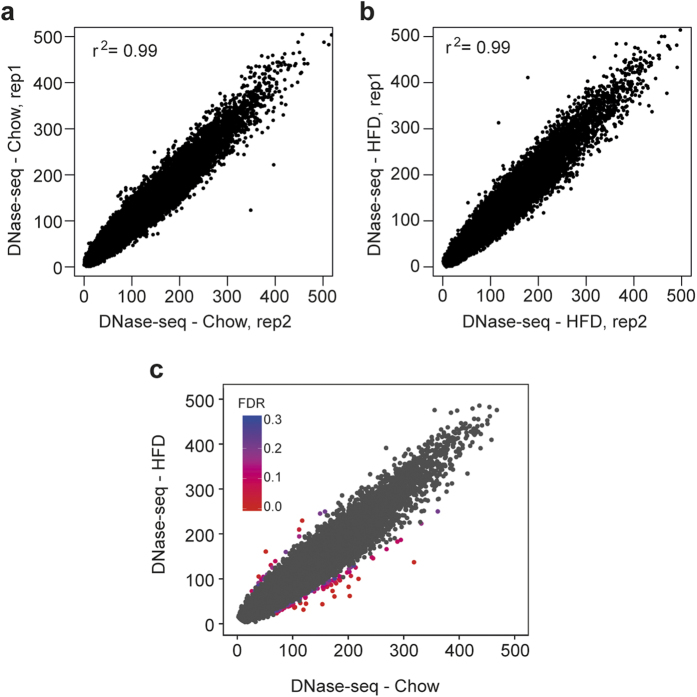
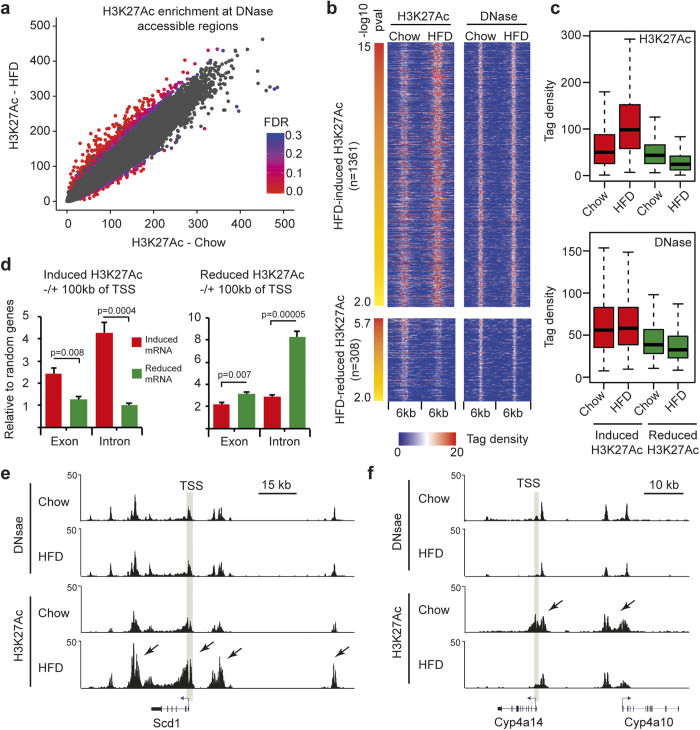
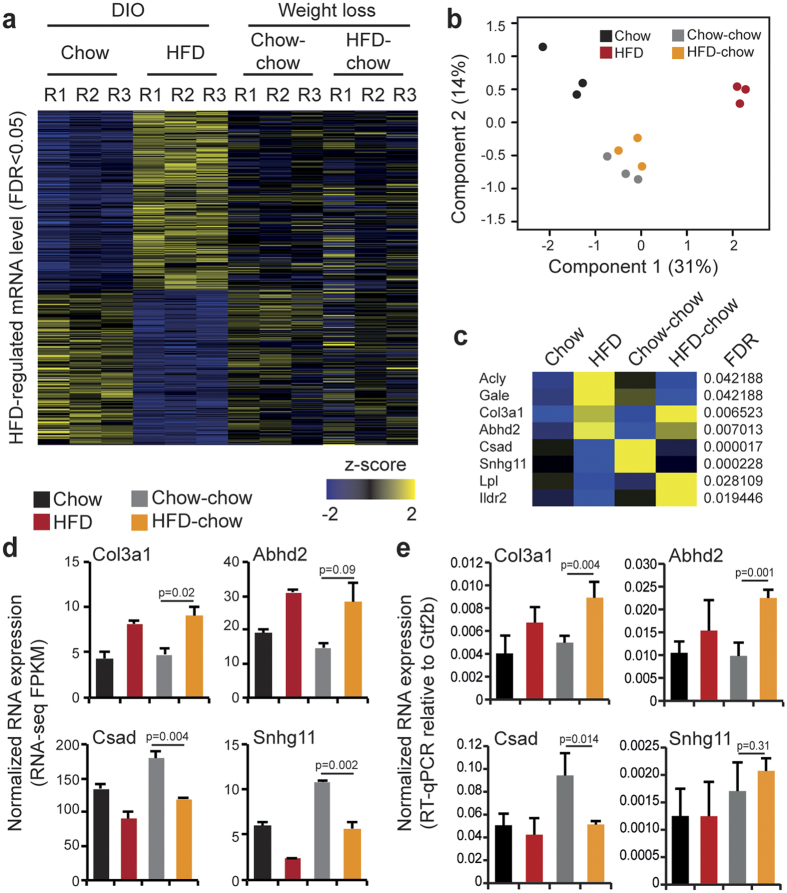
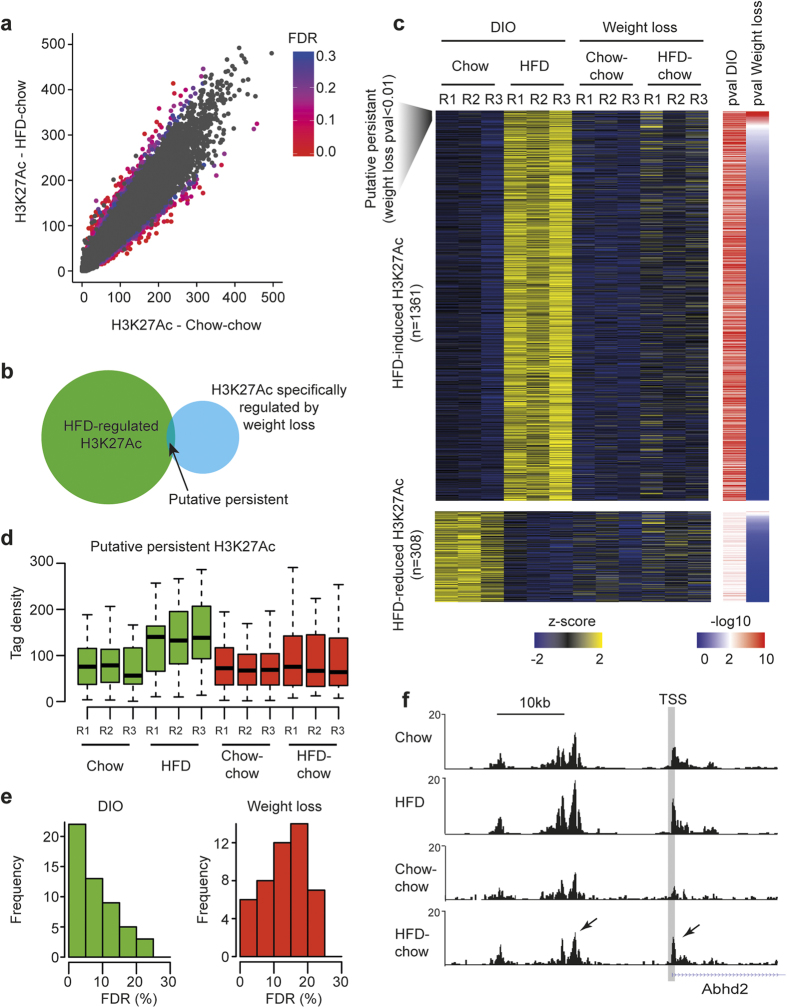
Epigenetic factors have been suggested to play an important role in metabolic memory by trapping and maintaining initial metabolic changes within the transcriptional regulatory machinery. In this study we fed mice a high fat diet (HFD) for seven weeks followed by additional five weeks of chow, to identify HFD-mediated changes to the hepatic transcriptional program that may persist after weight loss. Mice fed a HFD displayed increased fasting insulin levels, hepatosteatosis and major changes in hepatic gene transcription associated with modulation of H3K27Ac at enhancers, but no significant changes in chromatin accessibility, indicating that HFD-regulated gene transcription is primarily controlled by modulating the activity of pre-established enhancers. After return to the same body weight as chow fed control mice, the fasting insulin, glucose, and hepatic triglyceride levels were fully restored to normal levels. Moreover, HFD-regulated H3K27Ac and mRNA levels returned to similar levels as control mice. These data demonstrates that the transcription regulatory landscape in the liver induced by HFD is highly dynamic and can be reversed by weight loss. This provides hope for efficient treatment of early obesity-associated changes to hepatic complications by simple weight loss intervention without persistent reprograming of the liver transcriptome.


Figures

Figure 1
Figure 1. HFD-induced hyperinsulinemia and increased hepatic lipid accumulation is reversed by return to chow diet.
(a) Male 12 week old C57BL/6 J mice were fed a HFD (broken line, red) or chow diet (solid line, black) for seven weeks (7w) where half of the mice were sacrificed (Chow and HFD). The remaining HFD and chow mice were switched to or continued on a chow diet for additional five weeks (12w), respectively (Chow-chow, solid gray line and HFD-chow, broken orange line). (b) Mouse body weight was examined throughout the experiment (n > 4). (c) Serum glucose levels (HFD-chow and Chow-chow n = 6) and (d) insulin levels (chow and HFD n = 3, Chow-chow and HFD-chow n = 6) after 5 h of fasting. (e) Representative H&E staining of liver sections (8 μm, 20x magnification) and f) quantification of liver TG levels per tissue weight (mg) in Chow, HFD, Chow-chow and HFD-chow mice (n = 3). Statistical test was performed by two-tailed t-test. Error bars represent standard error of the mean (SEM).
Figure 2
Figure 2. The liver transcriptome of HFD mice before and after weight loss.
RNA-seq from livers of three mice from each group; Chow, HFD was analyzed for (a) differential mRNA levels using DESeq2. FDR value < 0.3 is indicated with heatmap. Data points with FDR > 0.3 are colored black. The number of genes with log2 fold change (FC) more or less than zero and FDR < 0.05 is indicated in figure. (b) RNA-seq data visualization of Scd1 locus in Chow and HFD mice with focus on exon (left) and intron (right) RNA reads. Intronic reads are marked red. (c) Quantification of exon versus intron mRNA reads using the iRNA pipeline in Chow and HFD mice, grouped into HFD-induced or -repressed genes. Regulated genes are scored based on FDR (exon) <0.01 and 1.5 fold change (FC). A z-score is calculated for the RNA-seq data to normalize tag counts within exons and introns. FDR values from HFD-regulated intron RNA expression are indicated with a heatmap. (d) Fraction of genes up- (yellow) and downregulated (blue) by ongoing transcription after HFD at different FDR for HFD-regulated intron RNA expression. (e) Normalized (Reads Per Kilobase Million) intron read count from HFD-regulated genes: Scd1, Fasn, Fgf21, Mfsd2a (upregulated by HFD, upper panel) and Cyp4a14, Angptl4, Irs2, and Nfil2 (downregulated by HFD, lower panel). Error bars represent SEM.
Figure 3
Figure 3. Chromatin remodeling remains largely unchanged in response to HFD.
Scatter plots illustrating level of DNase accessibility for replicate 1 and 2 of (a) Chow and (b) HFD and (c) in HFD versus Chow group. Differential DNase accessibility is indicated by FDR values identified by DESeq2 (n = 2). FDR levels are shown with indicated heatmap, where red represents the most statistical significant data points. Gray data points represents differential DNase accessibility at FDR > 0.3.
Figure 4
Figure 4. Pre-established enhancers change H3K27Ac level in response to HFD.
(a) H3K27Ac ChIP-seq enrichment was quantified at all identified DNase accessible regions and DESeq2 was used to identify differential H3K27Ac. FDR is indicated with heatmap, where red represents the most statistical significant data points. Gray data points represents differential H3K27Ac at FDR > 0.3. (b) Differentially H3K27Ac (p < 0.01) ranked according to p-value. Corresponding DNase accessibility is plotted in the left panel. (c) H3K27Ac ChIP-seq and DNase-seq tag densities at regions where HFD induce (red) and reduce (green) H3K27Ac. (d) Enrichment of induced (left panel) or reduced (right panel) H3K27Ac relative to multiple rounds (n = 4) of 200 randomly selected genes within 100 kb of TSS of genes HFD up- (red) or downregulated (green) genes scored by intron or exon reads. Statistical test was performed by two-tailed t-test. Error bars represent SEM. (e) Screen shots of DNase accessibility and H3K27Ac regions around Scd1 and (f) Cyp4a14 genes. TSS: Transcription start site. Arrows indicate differentially regulated H3K27Ac.
Figure 5
Figure 5. HFD-regulated transcriptome returns to normal after weight loss.
(a) RNA-seq read count for each biological replicate in Chow, HFD, Chow-chow and HFD-chow conditions at HFD-regulated genes (at FDR < 0.05). Read counts are visualized as z-scores. (b) Principle component analysis of each biological RNA-seq replicate in Chow, HFD, Chow-chow and HFD-chow conditions. (c) RNA-seq read count at HFD-regulated genes also regulated after weight loss (Genes with FDR < 0.05 is visualized). Average read counts (n = 3) are visualized as z-scores. (d) Normalized mRNA expression from selected HFD-regulated genes persistently expressed after weight loss. RNA-seq tag count at exons is plotted as Fragments Per Kilobase per Million mapped reads (FPKM). Statistical test was performed by two-tailed t-test, n = 3. Error bars represent SEM. (e) RT-qPCR validation RNA-seq data. Data is normalized to General transcription factor 2b (Gtf2b) expression. Statistical test was performed by two-tailed t-test, n = 3–4. Error bars represent SEM.
Figure 6
Figure 6. HFD-regulated H3K27Ac levels returns to normal after weight loss.
(a) H3K27Ac ChIP-seq in livers from HFD-chow and Chow-chow mice. Significance levels (FDR) are shown with color codes (right panel), where red represents most statistical significant values. Gray data points represents differential H3K27Ac at FDR > 0.3. (b) Venn diagram of HFD-regulated H3K27Ac regions at FDR < 0.1 (green) overlapping with differentially regulated H3K27Ac regions in HFD-chow mice compared to Chow-chow at FDR < 0.1 (blue). Overlapping regions represent putative persistent H3K27Ac deposited by HFD. (c) H3K27Ac level in DIO mice (HFD group) compared to DIO after weight loss (HFD-chow group). All HFD-regulated enhancers are shown. H3K27Ac level is normalized to a Z-score for each individual replicate. Heatmaps representing p-values (calculated by DESeq2) for HFD-regulated H3K27Ac is shown to the right. Red color represents most statistical significant changes. Putative persistent regions are identified using a cutoff of p-value < 0.01. (d) Tag densities of putative persistent H3K27Ac in three replicates from Chow, HFD, Chow-chow and HFD-chow mice. Green boxplots shows H3K27Ac changes at putative persistent acetylated enhancers in Chow and HFD fed mice. Red boxplots shows H3K27Ac changes at putative persistent acetylated enhancers in Chow-chow and HFD-chow fed mice. (e) FDR of differentially putative persistent H3K27Ac regions in Chow compared to HFD (green, DIO, left panel) and Chow-chow compared to HFD-chow (red, weight loss, right panel). (f) H3K27Ac in Chow, HFD, Chow-chow, and HFD-chow mice around TSS of the Abhd2 gene. Arrows mark regions with changed H3K27Ac after weight loss.

References

    1. Collaboration, N. C. D. R. F. Trends in adult body-mass index in 200 countries from 1975 to 2014: a pooled analysis of 1698 population-based measurement studies with 19.2 million participants. Lancet 387, 1377–1396, doi: 10.1016/S0140-6736(16)30054-X (2016). - DOI - PMC - PubMed
    1. Holman R. R., Paul S. K., Bethel M. A., Matthews D. R. & Neil H. A. 10-year follow-up of intensive glucose control in type 2 diabetes. N Engl J Med 359, 1577–1589, doi: 10.1056/NEJMoa0806470 (2008). - DOI - PubMed
    1. King P., Peacock I. & Donnelly R. The UK prospective diabetes study (UKPDS): clinical and therapeutic implications for type 2 diabetes. Br J Clin Pharmacol 48, 643–648 (1999). - PMC - PubMed
    1. Luna P., Guarner V., Farias J. M., Hernandez-Pacheco G. & Martinez M. Importance of Metabolic Memory in the Development of Vascular Complications in Diabetic Patients. J Cardiothorac Vasc Anesth, doi: 10.1053/j.jvca.2016.02.008 (2016). - DOI - PubMed
    1. Leung A. et al. Open chromatin profiling in mice livers reveals unique chromatin variations induced by high fat diet. The Journal of biological chemistry 289, 23557–23567, doi: 10.1074/jbc.M114.581439 (2014). - DOI - PMC - PubMed

Publication types