. 2017 Jan 10:7:40245.
doi: 10.1038/srep40245.

spict, a cyst cell-specific gene, regulates starvation-induced spermatogonial cell death in the Drosophila testis

Affiliations

spict, a cyst cell-specific gene, regulates starvation-induced spermatogonial cell death in the Drosophila testis

Ason C-Y Chiang et al. Sci Rep. .

Abstract

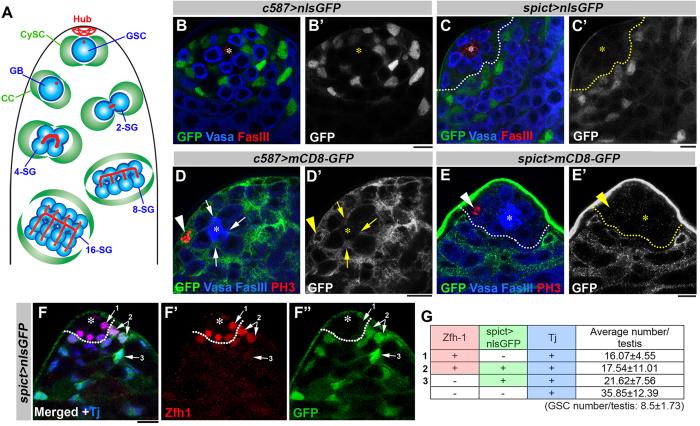
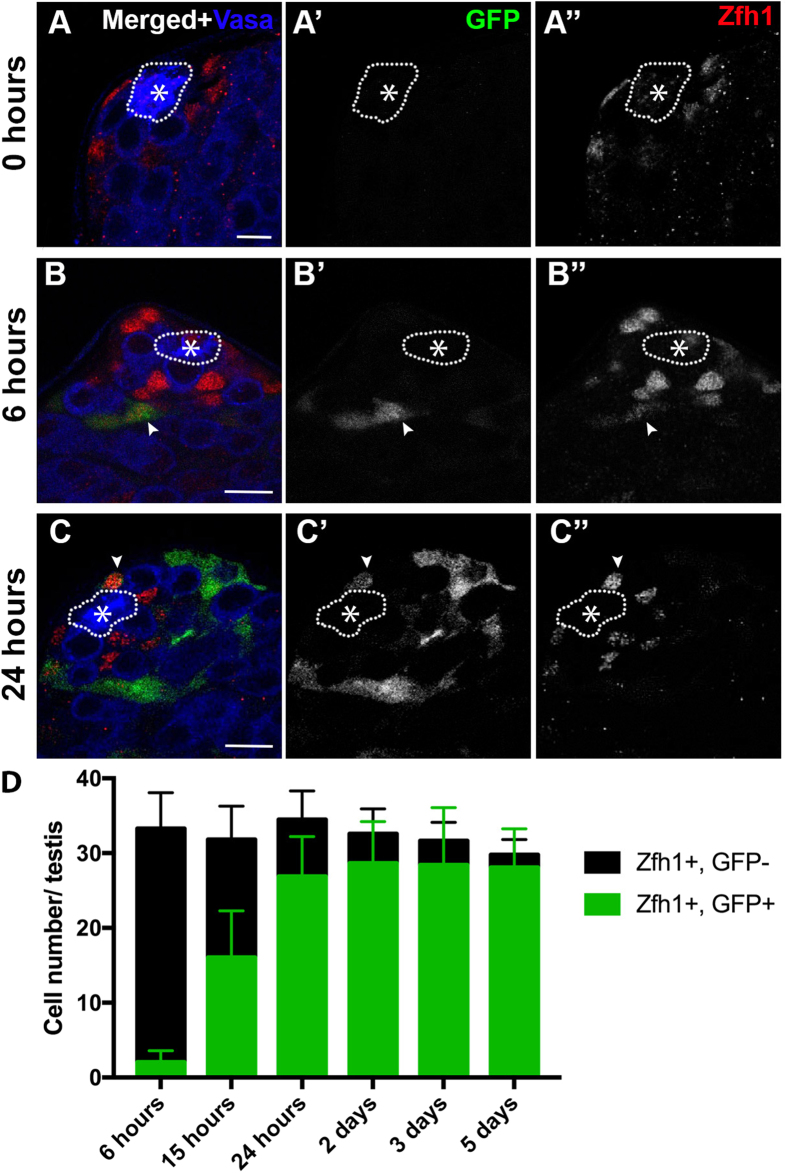
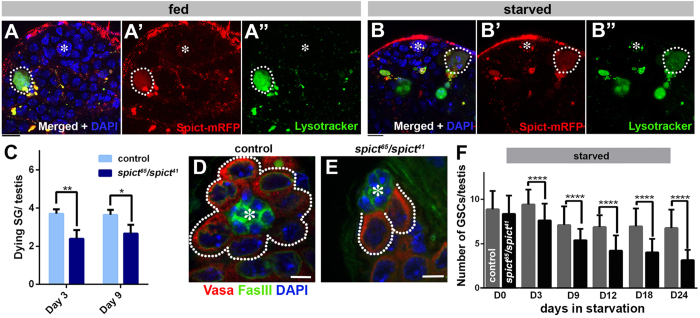
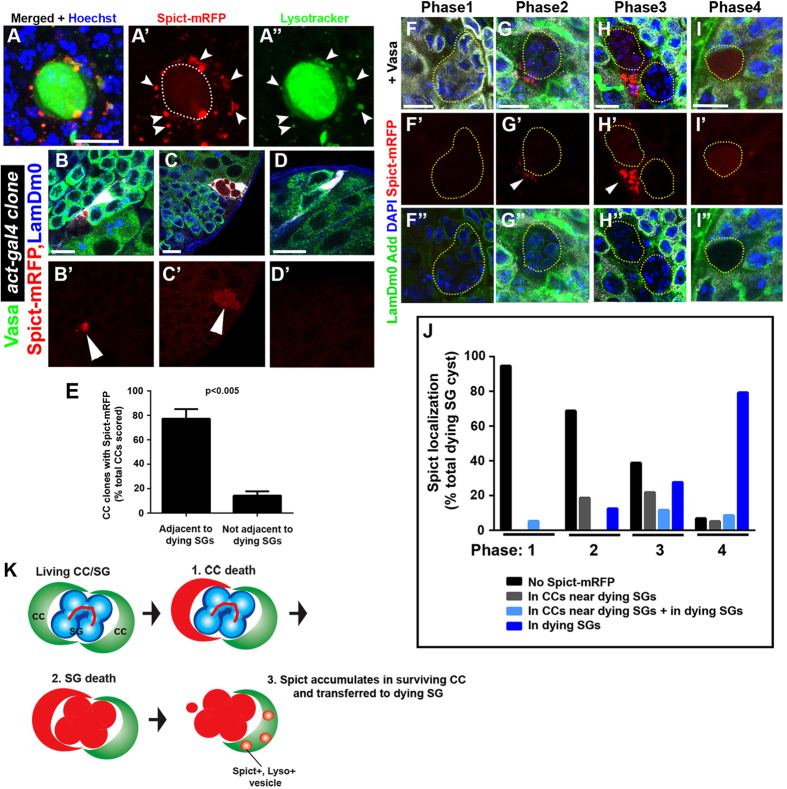
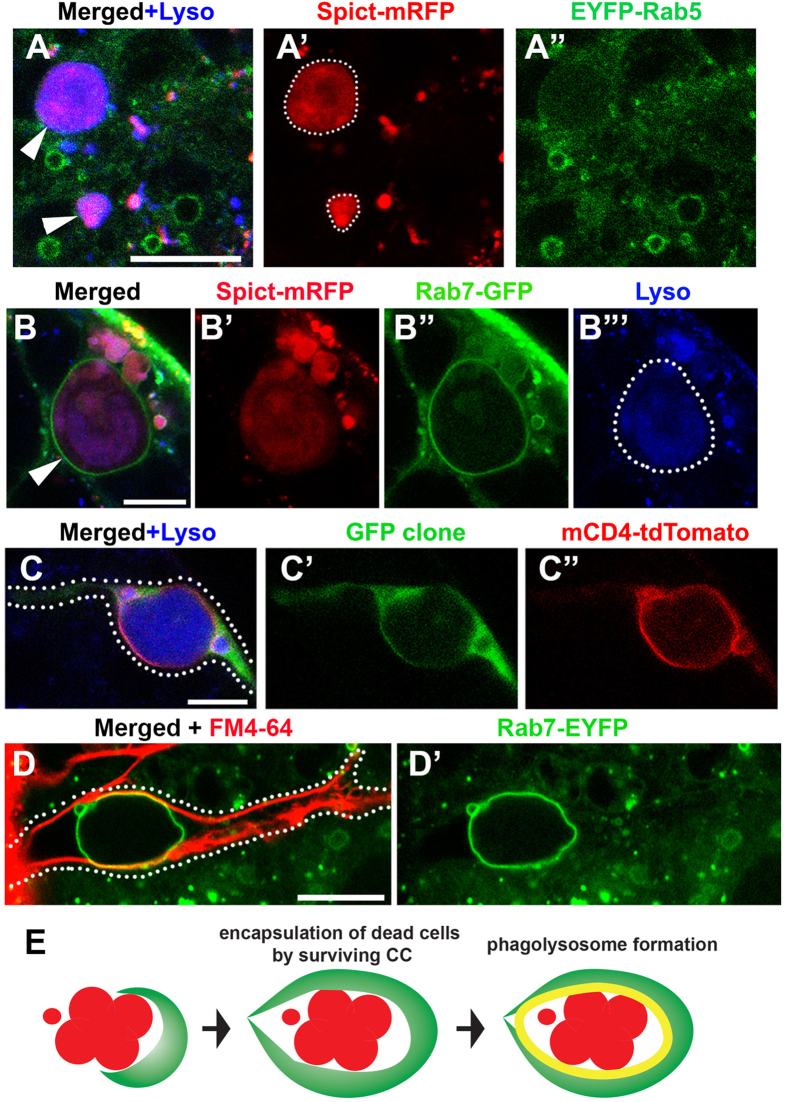
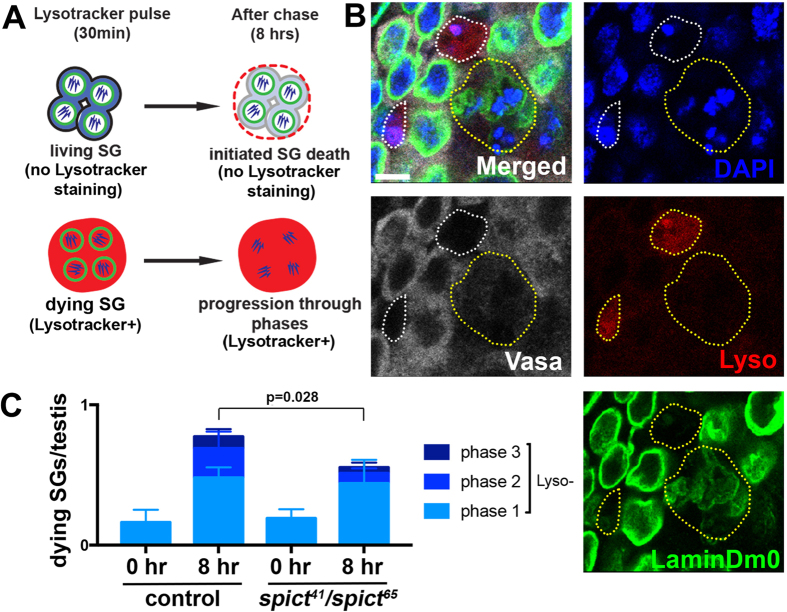
Tissues are maintained in a homeostatic state by balancing the constant loss of old cells with the continued production of new cells. Tissue homeostasis can shift between high and low turnover states to cope with environmental changes such as nutrient availability. Recently, we discovered that the elimination of transit-amplifying cells plays a critical role in maintaining the stem cell population during protein starvation in the Drosophila testis. Here, we identify spict, a gene expressed specifically in differentiating cyst cells, as a regulator of spermatogonial death. Spict is upregulated in cyst cells that phagocytose dying spermatogonia. We propose that phagocytosis and subsequent clearance of dead spermatogonia, which is partly promoted by Spict, contribute to stem cell maintenance during prolonged protein starvation.


Figures

Figure 1
Figure 1. spict is expressed in differentiating cyst cells.
(A) Diagram of early spermatogenesis at the apical tip of the Drosophila testis. Germline stem cells (GSCs), gonialblast (GB), 2,4,8,16-cell spermatogonia (SGs), cyst stem cells (CySCs), cyst cells (CCs). GSCs and CySCs are attached to the stem cell niche component hub cells. CySCs encapsulate GSCs. GSCs produce GBs by asymmetric division. GBs are encapsulated by CCs, which promote differentiation of germ cells as SGs. (B,C) Expression of UAS-nlsGFP under the control of the c587-gal4 driver (B) or the spict-gal4 driver (C). nlsGFP illuminates the nuclei of gal4-expressing cells. Asterisk indicates the hub; a dotted line indicates the boundary of spict expression. Bar: 5 μm. (D,E) Expression of UAS-mCD8-GFP under the control of the c587-gal4 driver (D) or the spict-gal4 driver (E). mCD8-GFP outlines the cell surfaces of gal4-expressing cells. Processes of cyst cells are outlined by expression of membrane-bound UAS-mCD8-GFP with the pan-cyst cell driver c587-gal4 (D) or spict-gal4 (E). Mitotic cells are labeled with PH3 (arrowhead). CySC processes that touch the hub are indicated by arrows (D,D’). (F) Apical tip of a testis showing nlsGFP expression under control of the spict-gal4 driver and co-stained with Zfh-1 (red) and Tj (blue). Tj is a marker for early CCs. (G) Quantification of somatic cells based on the expression of Zfh-1, Tj and spict > nls-GFP. The data are shown as mean ± s.d. N = 13 testes were scored.
Figure 2
Figure 2. Lineage tracing of spict-expressing cells in the testis reveals the frequent conversion of spict-positive cells into CySCs.
(AC) spict-gal4; UAS-FLP flies were crossed with Act > stop > gal4, UAS-EGFP; tubP-gal80ts at the permissive temperature (18 °C) until eclosion (A, 0 hours). Upon eclosion, adult flies were transferred to the non-permissive temperature (29 °C) for 6 hours (B), and 24 hours (C). Zfh-1-positive, GFP-positive CCs (arrowheads) appear after 6 hours, and Zfh-1-positive, GFP-positive CySCs appear after 24 hours (C). Bar: 10 μm. The hub is indicated by an asterisk and outlined by a dotted line. (D) Quantification of Zfh-1-positive cells based on GFP expression. The data are shown as mean ± s.d. N > 15 testes were scored for each time point.
Figure 3
Figure 3. spict is required for SG death and GSC maintenance during protein starvation.
(A,B) Localization of Spict-mRFP (spict-gal4 > UAS-spict-mRFP) in an adult testis under fed (A) and protein-starved conditions (B). A dotted line encircles dying SG; Bar: 10 μm. (C) Quantification of SG death in control (spict41/CyO) and mutant (spict65/spict41) testes upon 3 and 9 days of protein starvation. The data are shown as mean ± s.d. N > 120 testes were scored for each data point. *P < 0.05, **P < 0.005 (Student’s t-test, two-tailed). (D,E) Examples of the apical tip after 24 days of protein starvation in control (D) and spict65/spict41mutant (E) testes. GSCs are indicated by dotted lines. The hub is indicated by asterisks. Bar: 5 μm. (F) GSC number in control (gray) and spict65/spict41mutant (black bar) testes during protein starvation. The data are shown as mean ± s.d. N = 15 testes were scored for each data point. (****P < 0.00005, Student’s t-test, two-tailed).
Figure 4
Figure 4. Spict localizes to CCs associated with dying SG and transferred to dying SGs.
(A) An example of dying SGs positive for Lysotracker (green) and Spict-mRFP (red) in a spict-gal4 > UAS-spict-mRFP testis. Bar: 10 μm. (BD) Examples of CC clones that express Spict-mRFP in the presence (G,H) or absence (I) of neighboring dying SGs. Even though all CC clones (act-gal4-positive, white) activate UAS-spict-mRFP expression, Spict-mRFP protein was visible only when the clones were adjacent to dying SGs. Arrowheads indicate dying SGs (G’,H’). Bar: 10 μm. (E) Quantification of the percentage of Spict-mRFP-positive CC clones in the presence or absence of neighboring dying SGs. The data are shown as mean ± s.d. N > 60 clones were scored. p-value (Student’s t-test, two tailed) is provided. (FI) Representative images of Spict-mRFP localization during the course of SG death. Phase 1(B), phase 2 (C), phase 3 (D) and Phase 4 (E). Yellow dotted lines encircle the dying SGs. Arrowheads indicate CCs with upregulated Spict-mRFP near the dying SGs (C’,D’). Bar: 10 μm. (J) Distribution of Spict-mRFP localization during the course of SG death. (K) Model of the SG death process: the living SGs are encapsulated by a pair of CCs. The death of one CC (1) triggers SG death (2) and the Spict protein accumulates in the surviving CC and is transferred to the dying SGs (3).
Figure 5
Figure 5. Spict localizes to Rab7-positive phagosomes that encapsulate dying SGs.
(A) Spict-mRFP expressed in CCs (spict-gal4 > UAS-spict-mRFP) does not colocalize with the early endosome marker Rab5. Dying SGs are indicated by arrowheads. Bar: 10 μm. (B) The late endosome marker Rab7 colocalizes with Spict-mRFP and forms a large vesicle encapsulating dying SGs (arrowhead). Dying SG is encircled by dotted line in B”’. Bar: 5 μm. (C) An example of a single CC clone expressing GFP and mCD4-tdTomato (hs-FLP, act > stop > gal4, UAS-GFP, UAS-mCD4-tdTomato) encapsulating dying SGs entirely. A single CC clone is indicated by dotted line. Bar: 10 μm. (D) Rab7-EYFP testis stained for the membrane dye FM4-64 to label the CC plasma membrane, demonstrating that the Rab7-positive vesicle is entirely encapsulated within a single CC. CC boundary is indicated by dotted line. Bar: 10 μm. (E) Model of SG phagocytosis by the surviving CC.
Figure 6
Figure 6. spict regulates the progression of SG death.
(A) Schematic of the Lysotracker pulse-chase experiment. The dissected testes were stained with Lysotracker for 30 minutes and cultured in lysotracker-free media for 8 hours. SGs that initiated death during the 8 hour culture period are Lysotracker-negative, whereas SGs that were already dying at the beginning of culture are Lysotracker-positive. Dying SGs were identified by DAPI, Vasa and LaminDm0 staining. (B) Example of SGs that initiated the death process during the chase period (Lysotracker-negative, yellow dotted line) and those that were already dying during pulse period (Lysotracker-positive, white dotted lines). Bar: 5 μm. (C) Quantification of cell death phase for SGs that committed to death during the chase period (lysotracker-negative). The data are shown as mean ± s.d. N > 90 testes were scored for each genotype. p-value (Student’s t-test, two tailed) is provided.

References

    1. Angelo G. & Van Gilst M. R. Starvation protects germline stem cells and extends reproductive longevity in C. elegans. Science 326, 954–958, doi: 1178343 10.1126/science.1178343 (2009). - DOI - PubMed
    1. McLeod C. J., Wang L., Wong C. & Jones D. L. Stem cell dynamics in response to nutrient availability. Curr Biol 20, 2100–2105, doi: 10.1016/j.cub.2010.10.038 (2010). - DOI - PMC - PubMed
    1. Padilla P. A. & Ladage M. L. Suspended animation, diapause and quiescence: arresting the cell cycle in C. elegans. Cell Cycle 11, 1672–1679, doi: 10.4161/cc.19444 (2012). - DOI - PMC - PubMed
    1. Mihaylova M. M., Sabatini D. M. & Yilmaz O. H. Dietary and metabolic control of stem cell function in physiology and cancer. Cell stem cell 14, 292–305, doi: 10.1016/j.stem.2014.02.008 (2014). - DOI - PMC - PubMed
    1. Nakada D., Levi B. P. & Morrison S. J. Integrating physiological regulation with stem cell and tissue homeostasis. Neuron 70, 703–718, doi: 10.1016/j.neuron.2011.05.011 (2011). - DOI - PMC - PubMed

Publication types

LinkOut - more resources