. 2017 Jan 10:7:40285.
doi: 10.1038/srep40285.

Core Transcription Factors, MicroRNAs, and Small Molecules Drive Transdifferentiation of Human Fibroblasts Towards The Cardiac Cell Lineage

Affiliations

Core Transcription Factors, MicroRNAs, and Small Molecules Drive Transdifferentiation of Human Fibroblasts Towards The Cardiac Cell Lineage

Nicolas Christoforou et al. Sci Rep. .

Abstract

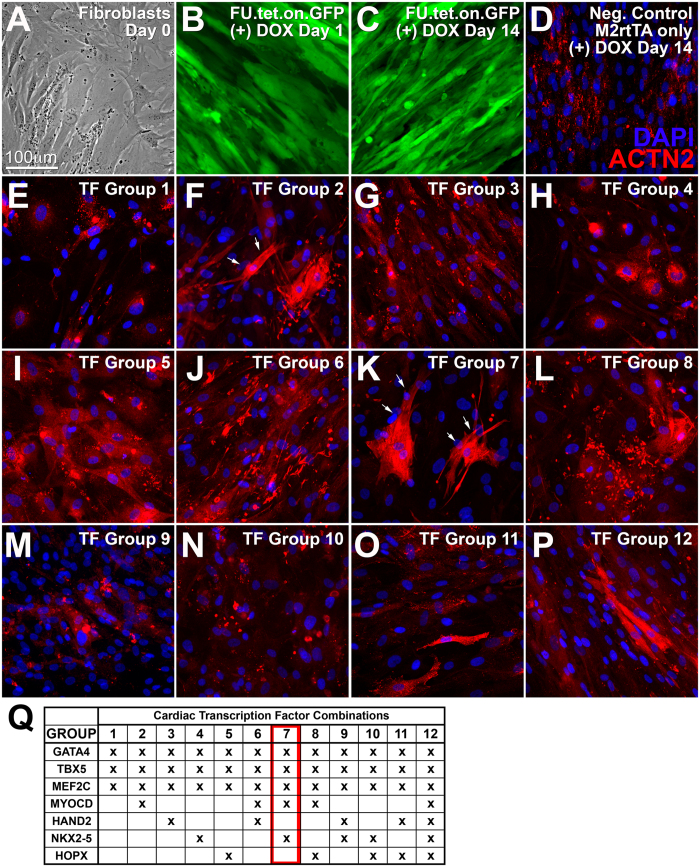
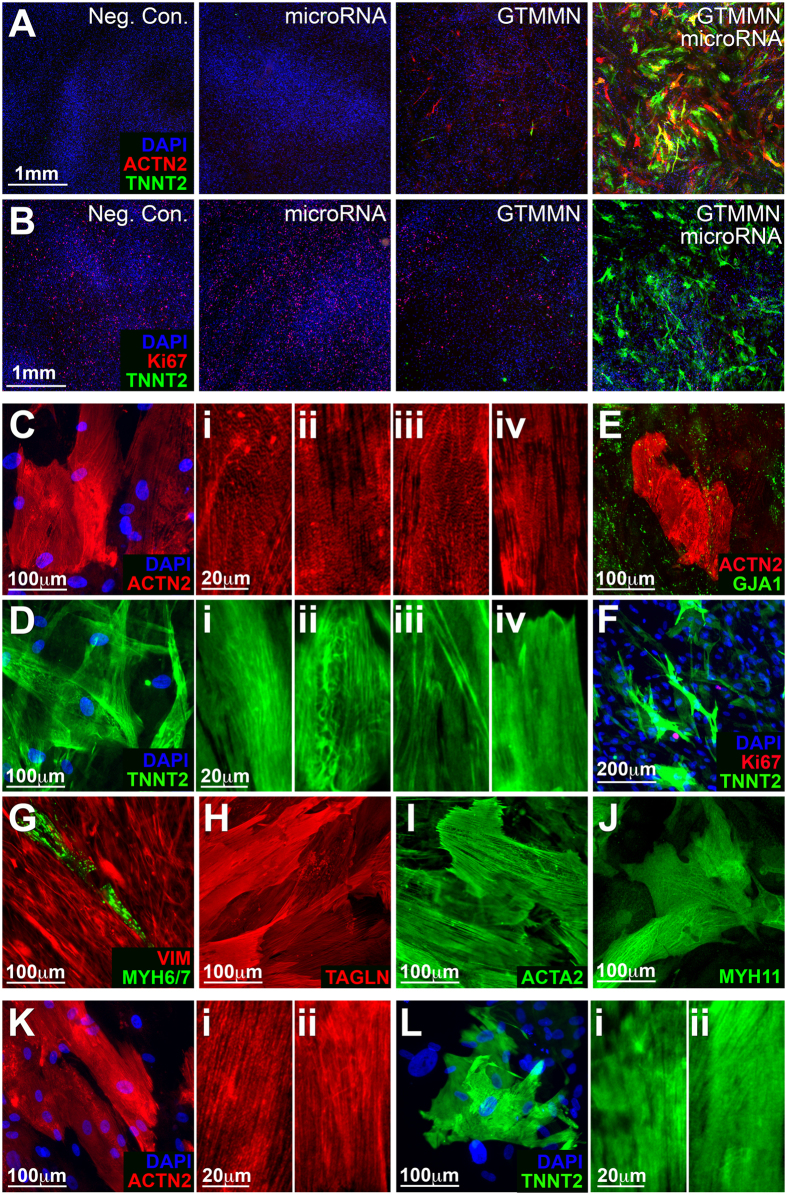
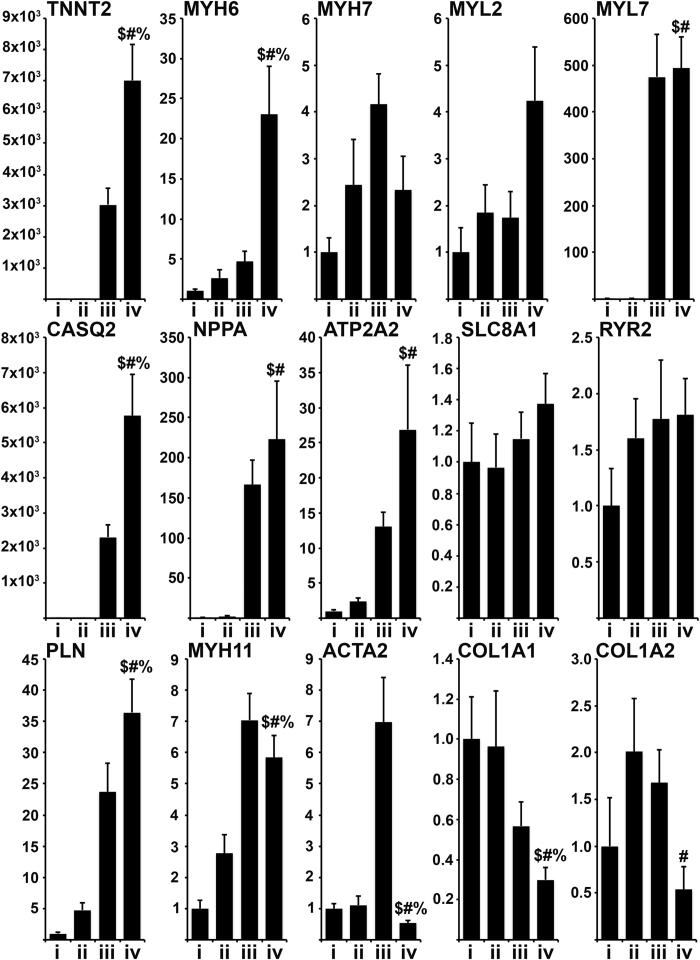
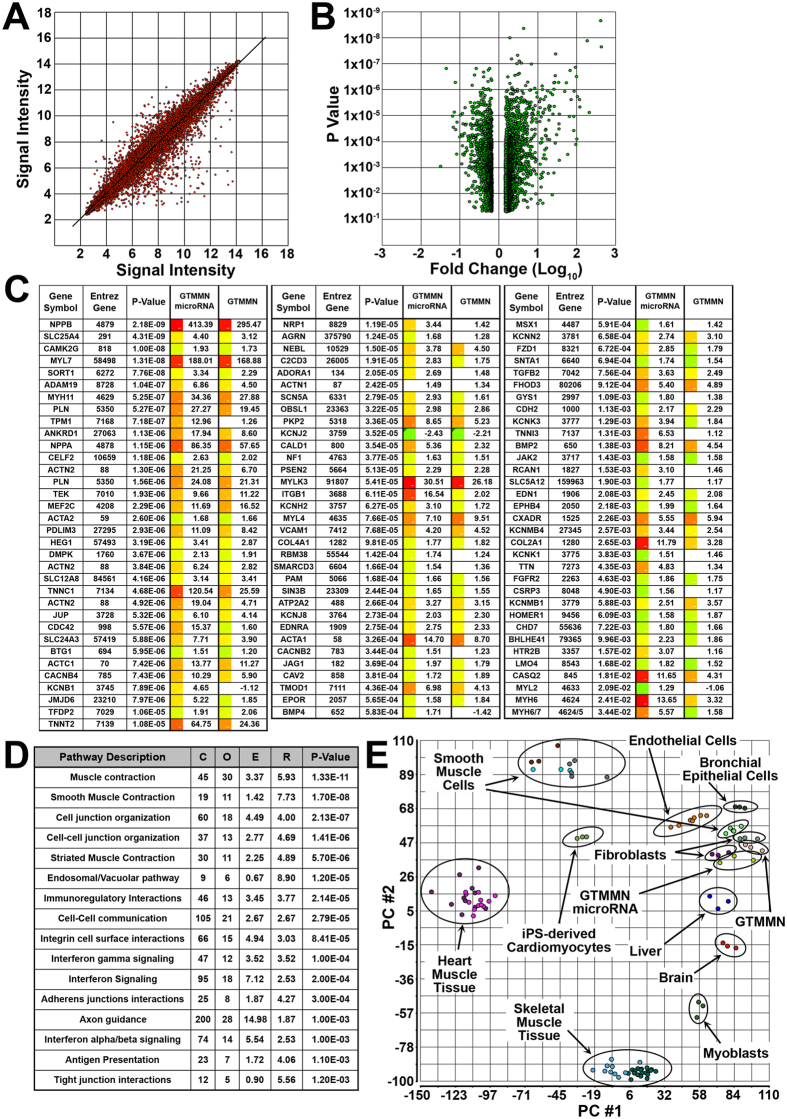
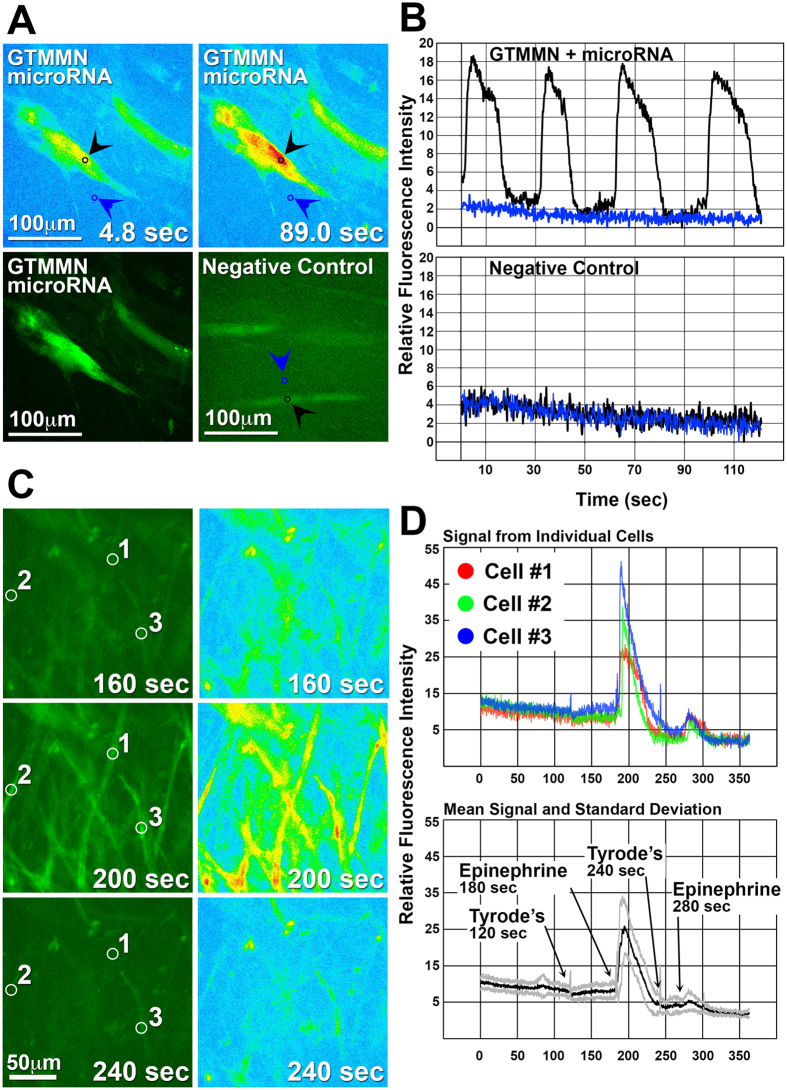
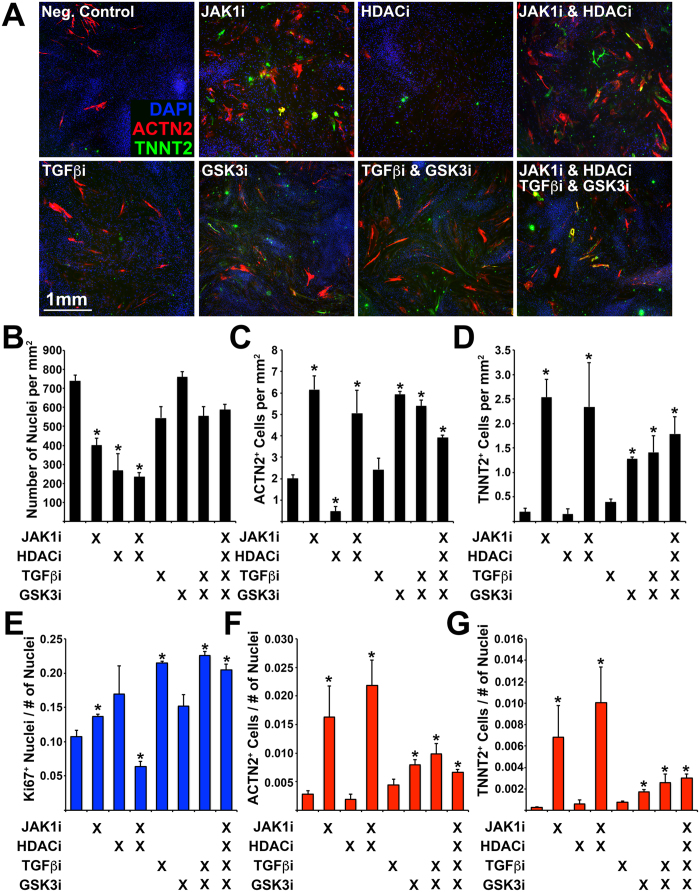
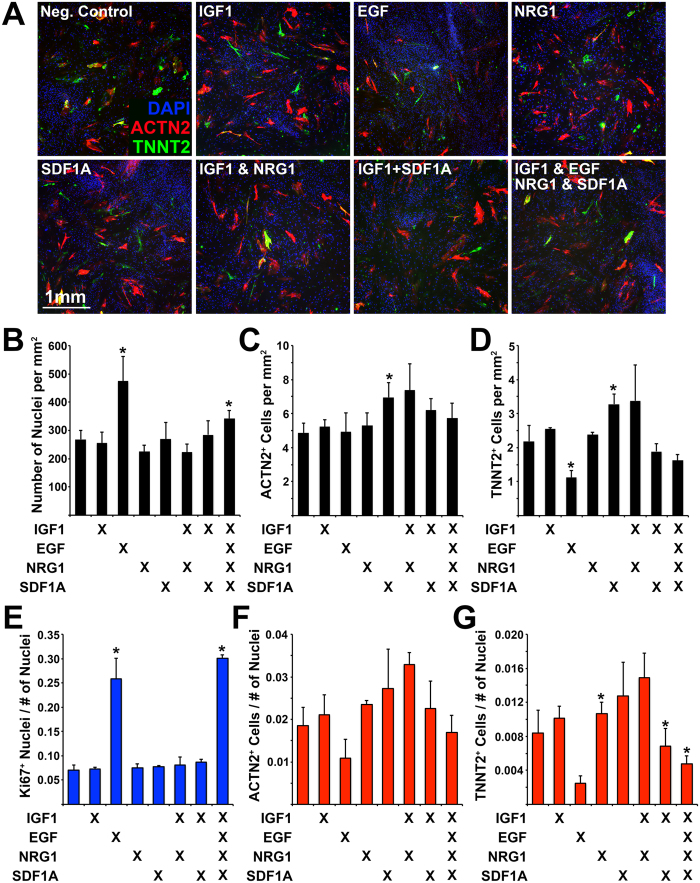
Transdifferentiation has been described as a novel method for converting human fibroblasts into induced cardiomyocyte-like cells. Such an approach can produce differentiated cells to study physiology or pathophysiology, examine drug interactions or toxicities, and engineer cardiac tissues. Here we describe the transdifferentiation of human dermal fibroblasts towards the cardiac cell lineage via the induced expression of transcription factors GATA4, TBX5, MEF2C, MYOCD, NKX2-5, and delivery of microRNAs miR-1 and miR-133a. Cells undergoing transdifferentiation expressed ACTN2 and TNNT2 and partially organized their cytoskeleton in a cross-striated manner. The conversion process was associated with significant upregulation of a cohort of cardiac-specific genes, activation of pathways associated with muscle contraction and physiology, and downregulation of fibroblastic markers. We used a genetically encoded calcium indicator and readily detected active calcium transients although no spontaneous contractions were observed in transdifferentiated cells. Finally, we determined that inhibition of Janus kinase 1, inhibition of Glycogen synthase kinase 3, or addition of NRG1 significantly enhanced the efficiency of transdifferentiation. Overall, we describe a method for achieving transdifferentiation of human dermal fibroblasts into induced cardiomyocyte-like cells via transcription factor overexpression, microRNA delivery, and molecular pathway manipulation.


Figures

Figure 1
Figure 1. Screen to determine the cardiac transdifferentiation-inducing effect of cardiac TF.
(A) HDF on day 0 prior to doxycycline addition. (B,C) Transduced HDF (M2rtTA and GFP) on day 1 or 14 post doxycycline addition. (D–P) HDF transduced with the various combinations of cardiac TF (according to table in panel Q). Expression of cardiac TFs was induced for 10 days. Immunofluorescence imaging for expression of ACTN2. White arrows indicate cells with significant ACTN2 expression in groups 2 and 7. (Q) Table detailing combinations of cardiac TFs being overexpressed in HDF.
Figure 2
Figure 2. Immunofluorescence characterization of transdifferentiated iCM (cardiac TF and microRNA).
(A) Expression of ACTN2 and TNNT2 or (B) Expression of TNNT2 and Ki67 in HDF transdifferentiated for 2 weeks using induced expression of GATA4, TBX5, MEF2C, MYOCD, NKX2-5 and transfection with hsa-miR-1 and hsa-miR-133a. (Controls: M2rtTA only, microRNA only, cardiac TF only). (C) ACTN2. Panels on the right show varying degrees of cytoskeletal organization of ACTN2. (D) TNNT2. Panels on the right show varying degrees of cytoskeletal organization of TNNT2. (E) ACTN2 and GJA1. (F) TNNT2 and Ki67 expression in iCM. (G) VIM and MYH6/7. (H) TAGLN. (I) SMA. (J) MYH11. (K) ACTN2 expression in iCM 4 weeks following initiation of transdifferentiation. Panels on the right show varying degrees of cytoskeletal organization of ACTN2. (L) TNNT2 expression in iCM 4 weeks following initiation of transdifferentiation. Panels on the right show varying degrees of cytoskeletal organization of TNNT2.
Figure 3
Figure 3. Gene expression analysis.
Relative gene expression analysis performed using RT-PCR on RNA isolated from cells being transdifferentiated for 14 days. Samples: (i) Negative Control, (ii) microRNA only, (iii) cardiac TF only, (iv) microRNA and cardiac TF. $ denotes significance compared to group i, # denotes significance compared to group ii,% denotes significance compared to group iii (ΔΔCt analysis, n: 4, Error Bar: Standard Deviation, T-Test: $ or # or % < 0.05).
Figure 4
Figure 4. Microarray gene expression analysis.
(A) Signal intensity plot for individual chip probes when comparing iCM (cardiac TF and microRNA) to control HDF. (B) Volcano plot displaying the relationship between P-Value determined using ANOVA versus calculated fold change for each probe. Comparison between iCM (cardiac TF and microRNA) and control HDF. Including only probes with defined fold change (< or >1.5) and significant P-Value (<0.05). (C) Fold change and P-Value of selected genes previously described as playing a role in cardiac cell development or function. Fold change is shown for cells transdifferentiated in the presence of cardiac TF and microRNA or cardiac TF only (Red: 413.39, Green: −2.43). (D) Molecular pathways associated with significantly upregulated genes when comparing iCM to control HDF as determined by the WEB-based GEne SeT AnaLysis Toolkit (WebGestalt). The “Gene #” column refers to the number of identified genes that belong to a particular pathway and the “P-value” column refers to the P-value of each of the pathways and based on the number of identified genes. (C) reference gene number in category, O: number of genes in gene set and category, E: expected number in category, R: enrichment ratio. (E) Principal component analysis performed on normalized signal values for each of the chip probes as well as probes from previously published studies.
Figure 5
Figure 5. Characterization of intracellular Ca2+ activity.
iCML cells and control HDF were transduced with a vector allowing the expression of GCaMP3 under the control of the TNNT2 promoter. (A,B) Fluorescence intensity imaging of temporal Ca2+ transients in an iCML or control cell (M2rtTA only). Black arrows denote the area of a cell at which data acquisition was performed (fluorescence intensity) and blue arrows denote a control area within the same frame. Acquired data was normalized and relative fluorescence intensity is presented in relation with elapsed time. Black and blue line correspond to the arrows in panel A. (C,D) Fluorescence intensity imaging of an iCML cell group being stimulated with epinephrine (100 μM). Number coding corresponds to areas within individual cells at which data acquisition was performed (fluorescence intensity). Top graph: Acquired data of individual iCML cells was normalized and relative fluorescence intensity is presented in relation with elapsed time. Bottom graph: The mean value of acquired data from multiple iCML cells (n = 12) is presented as a black line and the standard deviation is presented as the gray lines.
Figure 6
Figure 6. Determining the effect of small molecule inhibitors on transdifferentiation efficiency.
(A) Immunofluorescence of transdifferentiated cells (ACTN2/TNNT2) during exposure to small molecule inhibitors: Janus protein tyrosine kinase 1 (JAK1i), Sodium Butyrate (HDACi), SB431542 (TGFβi), CHIR99021 (GSK3i). (B) Number of nuclei, (C) Number of ACTN2+ cells, and (D) Number of TNNT2+ cells (per mm2). (E) Number of Ki67+ nuclei normalized to the total number of nuclei. (F) Number of ACTN2+ cells normalized to the total number of nuclei. (G) Number of TNNT2+ cells normalized to the total number of nuclei. Experiment performed in triplicate. 4 images were analyzed for each experiment. Error bar represents calculated standard deviation. Significant difference between two values was calculated using t-test (two-tailed distribution, two sample unequal variance).
Figure 7
Figure 7. Determining the effect of protein ligands on transdifferentiation efficiency.
(A) Immunofluorescence of transdifferentiated cells (ACTN2/TNNT2) during exposure to protein ligands: IGF1, EGF, NRG1, SDF1A. (B) Number of nuclei, (C) Number of ACTN2+ cells, and (D) Number of TNNT2+ cells (per mm2). (E) Number of Ki67+ nuclei normalized to the total number of nuclei. (F) Number of ACTN2+ cells normalized to the total number of nuclei. (G) Number of TNNT2+ cells normalized to the total number of nuclei. Experiment performed in triplicate. 4 images were analyzed for each experiment. Error bar represents calculated standard deviation. Significant difference between two values was calculated using t-test (two-tailed distribution, two sample unequal variance).

References

    1. Davis R. L., Weintraub H. & Lassar A. B. Expression of a single transfected cDNA converts fibroblasts to myoblasts. Cell 51, 987–1000 (1987). - PubMed
    1. Caiazzo M. et al.. Direct conversion of fibroblasts into functional astrocytes by defined transcription factors. Stem Cell Reports 4, 25–36, doi: 10.1016/j.stemcr.2014.12.002 (2015). - DOI - PMC - PubMed
    1. Huang P. et al.. Induction of functional hepatocyte-like cells from mouse fibroblasts by defined factors. Nature 475, 386–389, doi: 10.1038/nature10116 (2011). - DOI - PubMed
    1. Ieda M. et al.. Direct reprogramming of fibroblasts into functional cardiomyocytes by defined factors. Cell 142, 375–386, doi: 10.1016/j.cell.2010.07.002 (2010). - DOI - PMC - PubMed
    1. Ji H. et al.. Transdifferentiation of human endothelial progenitors into smooth muscle cells. Biomaterials 85, 180–194, doi: 10.1016/j.biomaterials.2016.01.066 (2016). - DOI - PMC - PubMed

Publication types

MeSH terms

LinkOut - more resources