

Noninvasive Monitoring of Blood Glucose with Raman Spectroscopy
- PMID: 28071894
- PMCID: PMC5896772
- DOI: 10.1021/acs.accounts.6b00472
Noninvasive Monitoring of Blood Glucose with Raman Spectroscopy
Abstract
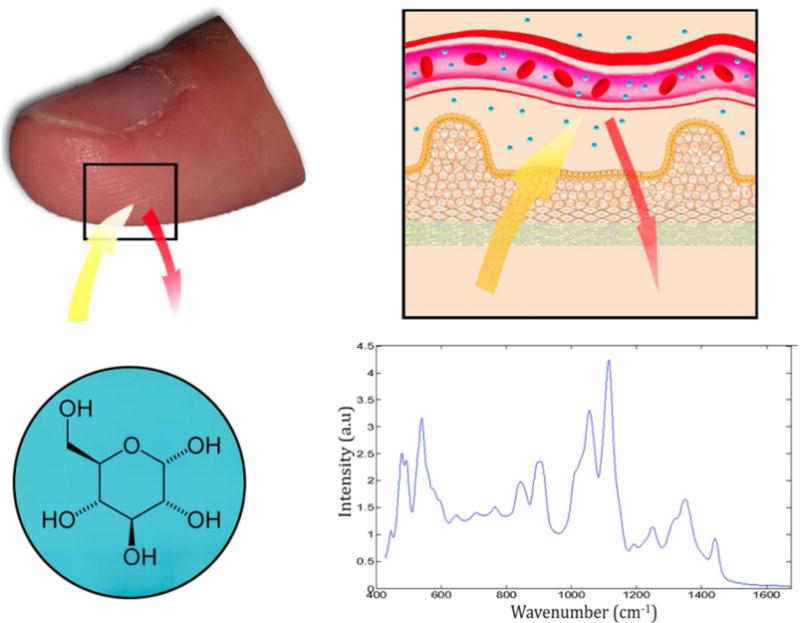
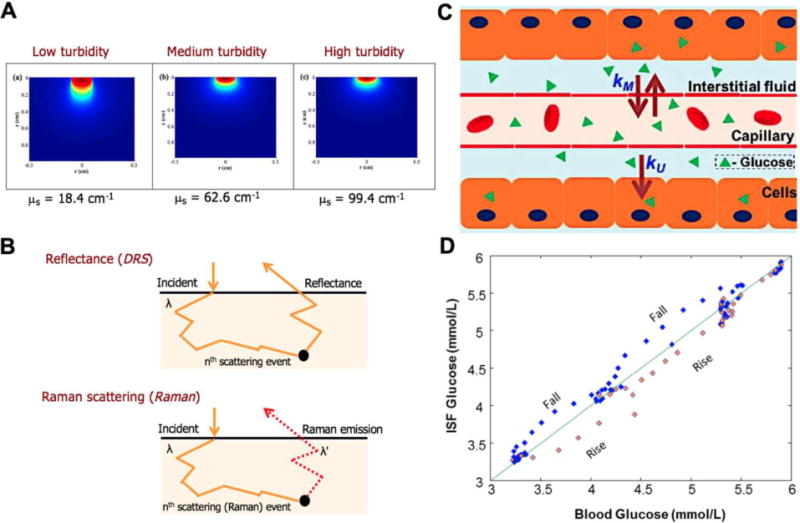
The successful development of a noninvasive blood glucose sensor that can operate reliably over sustained periods of time has been a much sought after but elusive goal in diabetes management. Since diabetes has no well-established cure, control of elevated glucose levels is critical for avoiding severe secondary health complications in multiple organs including the retina, kidney and vasculature. While fingerstick testing continues to be the mainstay of blood glucose detection, advances in electrochemical sensing-based minimally invasive approaches have opened the door for alternate methods that would considerably improve the quality of life for people with diabetes. In the quest for better sensing approaches, optical technologies have surfaced as attractive candidates as researchers have sought to exploit the endogenous contrast of glucose, notably its absorption, scattering, and polarization properties. Vibrational spectroscopy, especially spontaneous Raman scattering, has exhibited substantial promise due to its exquisite molecular specificity and minimal interference of water in the spectral profiles acquired from the blood-tissue matrix. Yet, it has hitherto been challenging to leverage the Raman scattering signatures of glucose for prediction in all but the most basic studies and under the least demanding conditions. In this Account, we discuss the newly developed array of methodologies that address the key challenges in measuring blood glucose accurately using Raman spectroscopy and unlock new prospects for translation to sustained noninvasive measurements in people with diabetes. Owing to the weak intensity of spontaneous Raman scattering, recent research has focused on enhancement of signals from the blood constituents by designing novel excitation-collection geometries and tissue modulation methods while our attempts have led to the incorporation of nonimaging optical elements. Additionally, invoking mass transfer modeling into chemometric algorithms has not only addressed the physiological lag between the actual blood glucose and the measured interstitial fluid glucose values but also offered a powerful tool for predictive measurements of hypoglycemia. This framework has recently been extended to provide longitudinal tracking of glucose concentration without necessitating extensive a priori concentration information. These findings are advanced by the results of recent glucose tolerance studies in human subjects, which also hint at the need for designing nonlinear calibration models that can account for subject-to-subject variations in skin heterogeneity and hematocrit levels. Together, the emerging evidence underscores the promise of a blood withdrawal-free optical platform-featuring a combination of high-throughput Raman spectroscopic instrumentation and data analysis of subtle variations in spectral expression-for diabetes screening in the clinic and, ultimately, for personalized monitoring.
Conflict of interest statement
The authors declare no competing financial interest.
Figures
References
-
- Aggidis AGA, Newman JD, Aggidis GA. Investigating pipeline and state of the art blood glucose biosensors to formulate next steps. Biosens Bioelectron. 2015;74:243–262. - PubMed
-
- Heller A, Feldman B. Electrochemistry in Diabetes Management. Acc Chem Res. 2010;43:963–973. - PubMed
-
- Zimmermann S, Fienbork D, Stoeber B, Flounders AW, Liepmann D. A microneedle-based glucose monitor: fabricated on a wafer-level using in-device enzyme immobilization. TRANSDUCERS, Solid-State Sensors, Actuators and Microsystems, 12th International Conference on 2003. 1:99–102.
Publication types
MeSH terms
Substances
Grants and funding
LinkOut - more resources
Full Text Sources
Other Literature Sources
Medical
