

Review
doi: 10.11138/fneur/2016.31.4.217.
Modeling white matter microstructure
- PMID: 28072382
- PMCID: PMC5231884
- DOI: 10.11138/fneur/2016.31.4.217
Item in Clipboard
Review
Modeling white matter microstructure
Funct Neurol.
2016 Oct/Dec.
Abstract
Quantitative magnetic resonance imaging can be combined with advanced biophysical models to measure microstructural features of white matter. Non-invasive microstructural imaging has the potential to revolutionize neuroscience, and acquiring these measures in clinically feasible times would greatly improve patient monitoring and clinical studies of drug efficacy. However, a good understanding of microstructural imaging techniques is essential to set realistic expectations and to prevent over-interpretation of results. This review explains the methodology behind microstructural modeling and imaging, and gives an overview of the breakthroughs and challenges associated with it.
Figures
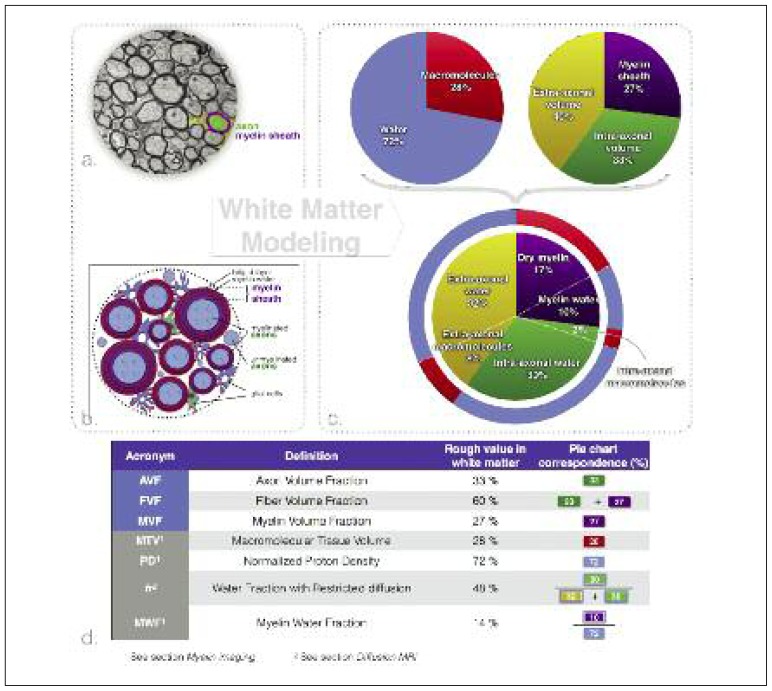
Modeling of white matter tissue. a. Transmission electron microscopy of an axial slice of white matter fiber bundles extracted from the corpus callosum of a mouse (West et al., 2016a). b. Schematic representation of the white matter. c. Proportions of the different white matter tissue components. The top left pie chart divides white matter into two general components: water (blue) (the component that produces the MRI signal) and lipids/macromolecules (red). The top right pie chart divides white matter into three spaces (used in diffusion and myelin imaging models): the myelin sheath (purple), the extra-axonal volume (yellow) and the intra-axonal volume (green). The bottom pie chart subdivides these three spaces into water and lipid/macromolecular content. d. Definitions of most commonly used MRI (gray boxes) and tissue modeling (light blue boxes) metrics and their rough values.
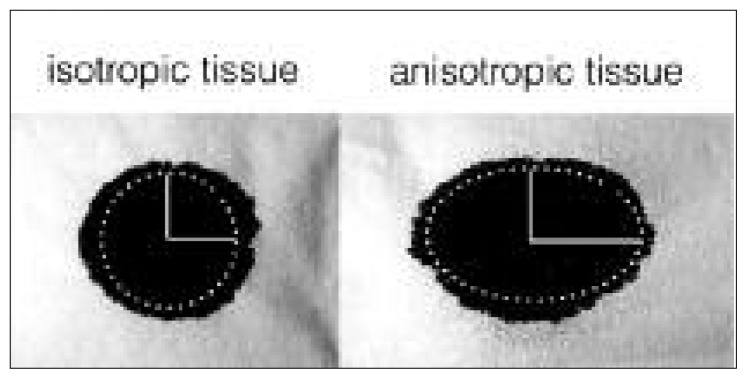
Diffusion reveals the underlying microstructure of the tissue. The diffusion of a drop of ink on isotropic (left) or anisotropic (right) fibrous tissue is Gaussian and can be modeled with an ellipse. The main axis of this ellipse (horizontal axis in this case) defines the main direction of the fibers that form the tissue. The ratio between the main and the secondary axis defines the degree of anisotropy of the paper. Similarly, diffusion in the white matter tissue is modeled with an ellipsoid in diffusion tensor imaging experiments. This figure was inspired by Dr Gordon Kindlmann (University of Chicago).
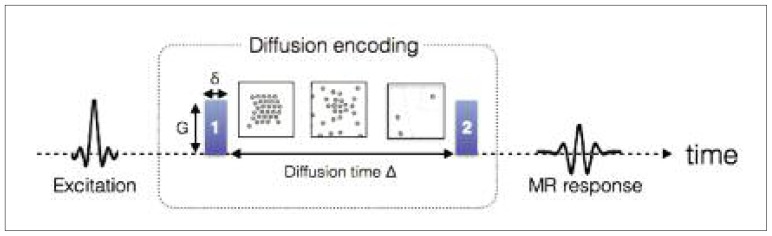
Timeline for encoding the diffusion of the water molecules in MRI. Just after being excited, the position of each molecule is tagged based on the phase of its spins, by applying gradient #1 (parametrized by its strength G and duration δ). During a time Δ, the spins (illustrated by small circles) move (due to Brownian motion or convection). The longer the time Δ is, the further the molecules can move. A second and identical gradient is applied to quantify this displacement through a signal loss in the MR response.
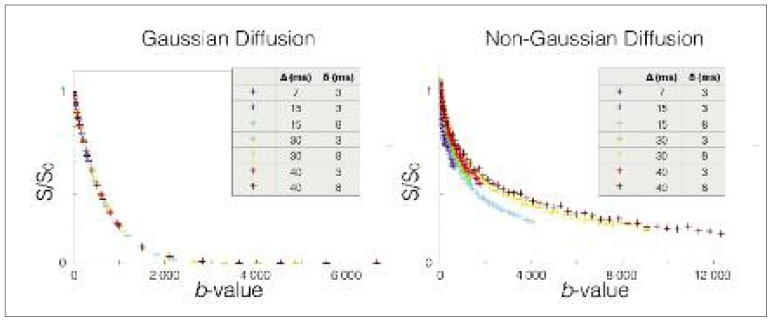
MRI signal as a function of b-value in voxels presenting Gaussian (left) or non-Gaussian (right) diffusion of water molecules. While conventional diffusion MRI assumes Gaussian diffusion characterized by dependence on the b-value only, diffusion perpendicular to neuronal fibers (right) is non-Gaussian, which allows the extraction of additional microstructural information such as axon diameter.
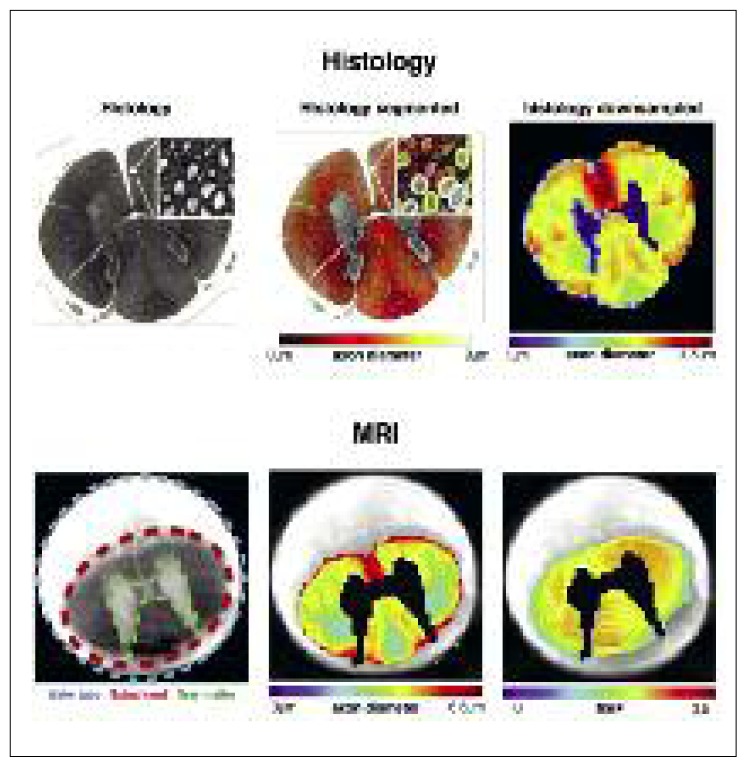
A comparison of ex vivo quantitative MRI maps with histology. Once segmented, histology can provide mean axon diameter or myelin volume fraction in a voxel. Visually, MRI and histology are in agreement, supporting the sensitivity of MRI to these specific microstructural properties.
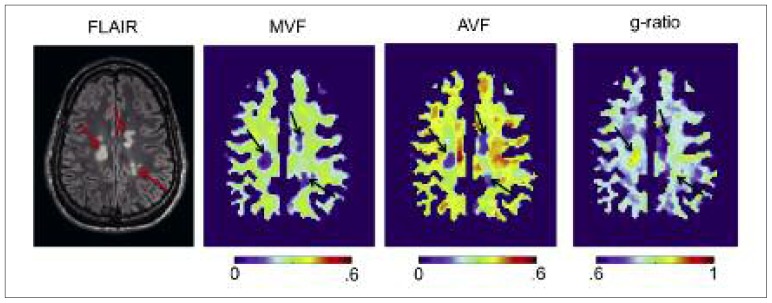
Example of multi-parametric quantitative MRI maps of a multiple sclerosis patient. Myelin volume fraction (MVF) was obtained using a qMT (Henkelman et al., 1993), axon volume fraction (AVF) was computed using the NODDI model (Zhang et al., 2012), and g-ratio was calculated from AVF and MVF (Stikov et al., 2015a). Conventional FLAIR contrast indicates the presence of three hyperintense lesions. These lesions are associated with a reduction in MVF and AVF, but only one lesion shows an abnormal g-ratio (>0.8).
References
-
- Adelman WJ, Jr, Arnold JM, Gilbert DL. Squid as Experimental Animals. New York, US: Springer; 2013.
-
- Alexander DC, Hubbard PL, Hall MG, et al. Orientationally invariant indices of axon diameter and density from diffusion MRI. Neuroimage. 2010;52:1374–1389. - PubMed
-
- Alexander DC. A general framework for experiment design in diffusion MRI and its application in measuring direct tissue-microstructure features. Magn Reson Med. 2008;60:439–448. - PubMed
-
- Arciénega II, Brunet JF, Bloch J, et al. Cell locations for AQP1, AQP4 and 9 in the non-human primate brain. Neuroscience. 2010;167:1103–1114. - PubMed
Publication types
MeSH terms
LinkOut - more resources
Full Text Sources
Medical