. 2017 Jan 10:6:e20331.
doi: 10.7554/eLife.20331.

BRAFV600E cooperates with CDX2 inactivation to promote serrated colorectal tumorigenesis

Affiliations

BRAFV600E cooperates with CDX2 inactivation to promote serrated colorectal tumorigenesis

Naoya Sakamoto et al. Elife. .

Abstract

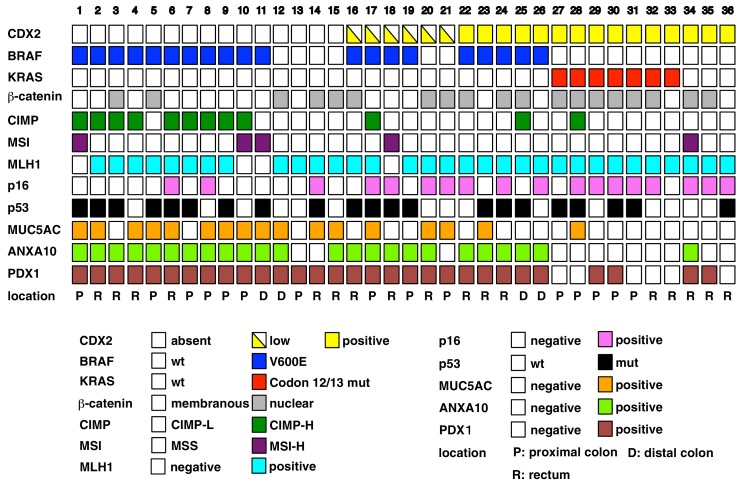
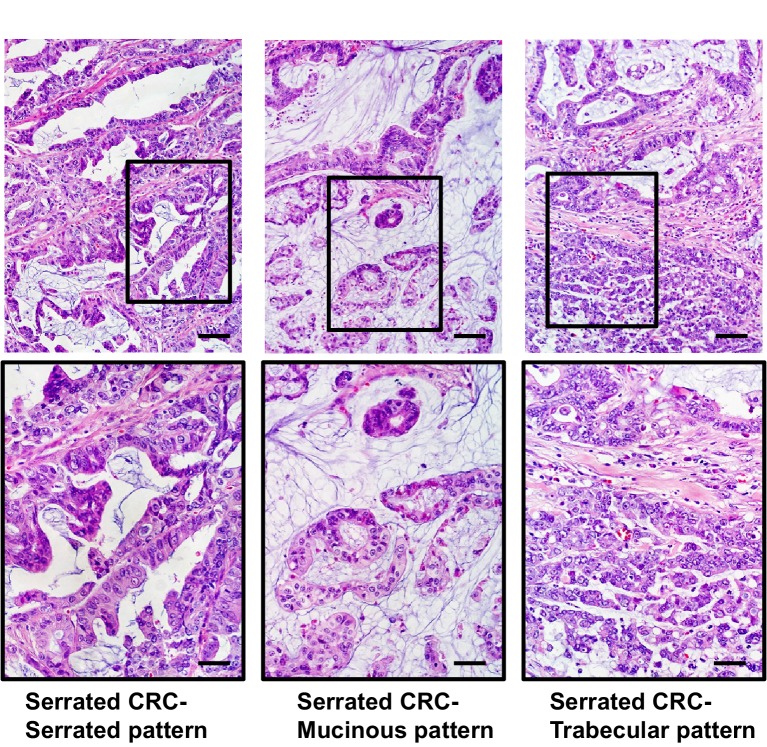
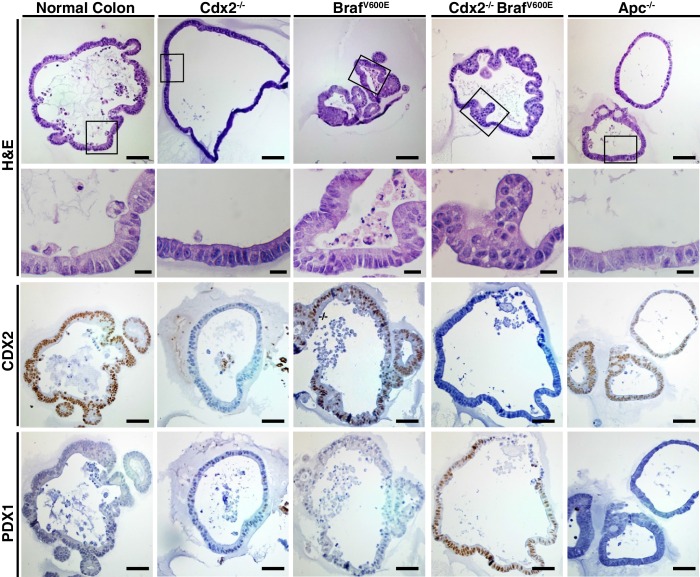
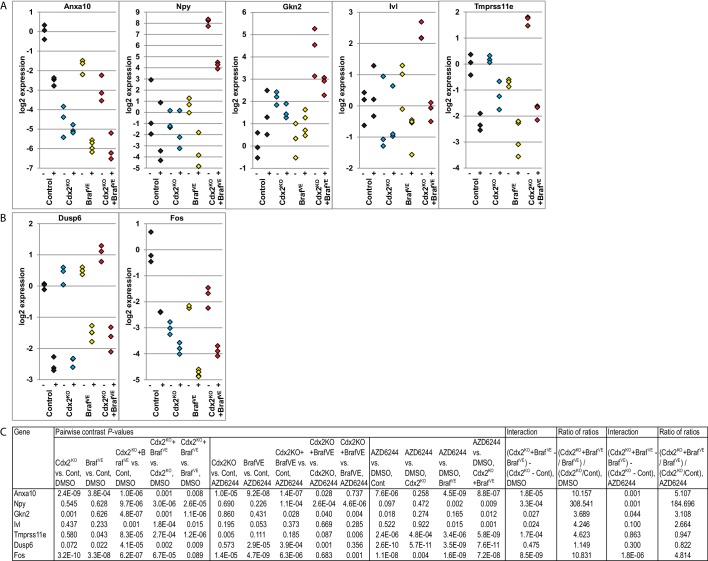
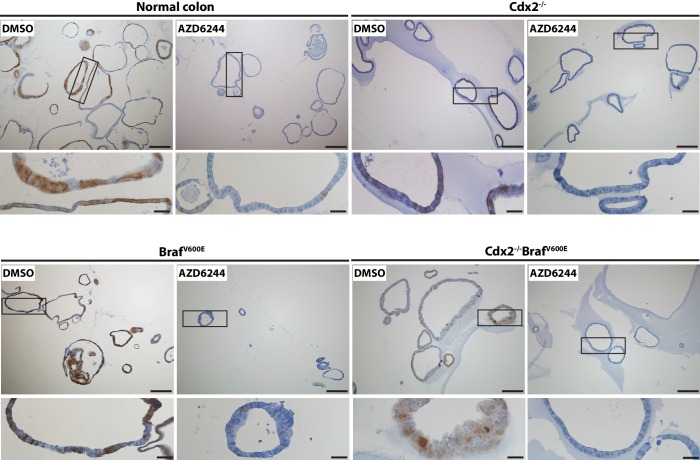
While 20-30% of colorectal cancers (CRCs) may arise from precursors with serrated glands, only 8-10% of CRCs manifest serrated morphology at diagnosis. Markers for distinguishing CRCs arising from 'serrated' versus 'conventional adenoma' precursors are lacking. We studied 36 human serrated CRCs and found CDX2 loss or BRAF mutations in ~60% of cases and often together (p=0.04). CDX2Null/BRAFV600E expression in adult mouse intestinal epithelium led to serrated morphology tumors (including carcinomas) and BRAFV600E potently interacted with CDX2 silencing to alter gene expression. Like human serrated lesions, CDX2Null/BRAFV600E-mutant epithelium expressed gastric markers. Organoids from CDX2Null/BRAFV600E-mutant colon epithelium showed serrated features, and partially recapitulated the gene expression pattern in mouse colon tissues. We present a novel mouse tumor model based on signature defects seen in many human serrated CRCs - CDX2 loss and BRAFV600E. The mouse intestinal tumors show significant phenotypic similarities to human serrated CRCs and inform about serrated CRC pathogenesis.

Keywords: cancer biology; cancer diagnosis; colorectal cancer; homeobox gene; human; human biology; intestinal differentiation; medicine; mouse; oncogene; tumor suppressor gene.


Conflict of interest statement

MM: Reviewing editor, eLife. The other authors declare that no competing interests exist.

Figures

Figure 1.
Figure 1.. Overview of the result of immunohistochemistry (IHC) and somatic changes for selected proteins, genes, and phenotypic marker panels.
Each square represents the results for IHCs and molecular phenotypic features in individual serrated adenocarcinoma cases. DOI: http://dx.doi.org/10.7554/eLife.20331.002
Figure 1—figure supplement 1.
Figure 1—figure supplement 1.. Representative images of serrated adenocarcinoma cases.
All of these cases have (i) well to moderately differentiated glands in which the epithelium has a serrated appearance, (ii) eosinophilic cytoplasm, (iii) vesicular nuclei with basal location at least. Serrated CRCs with mucinous and trabecular patterns showed such components occupying more than 50% of the tumor region and retained serrated cytology. Some cases showed dirty necrosis, but only rarely, and may also possess small areas of mucinous differentiation. Scale bars, 100 μm for low magnification; 50 μm for high magnification. DOI: http://dx.doi.org/10.7554/eLife.20331.004
Figure 1—figure supplement 2.
Figure 1—figure supplement 2.. Representative pattern of immunohistochemistry in serrated adenocarcinoma (SAC) cases with CDX2-negative (upper) and CDX2-positive (lower) staining.
The CDX2-negative SAC case showed membranous staining of β-catenin at invasive front, robust Annexin A10 and MUC5AC expression, but was negative for p16 expression. Conversely, the CDX2-positive SAC case showed nuclear staining of β-catenin at the invasive front, no Annexin A10 or MUC5AC expression, but was positive for p16 expression. Scale bars, 100 μm. DOI: http://dx.doi.org/10.7554/eLife.20331.005
Figure 2.
Figure 2.. Characteristics of CDX2P-CreERT2 Cdx2fl/fl BrafCA mice.
(A) Kaplan-Meier curves of CDX2P-CreERT2 Cdx2fl/fl BrafCA (Cdx2-/- BrafV600E, n = 7), CDX2P-CreERT2 Apcfl/+Cdx2fl/fl BrafCA (Apc+/- Cdx2-/- BrafV600E, n = 5), CDX2P-CreERT2 Cdx2fl/fl (Cdx2-/-, n = 6), and CDX2P-CreERT2 BrafCA (BrafV600E, n = 5) mice, after two daily doses of TAM (150 mg/kg). p<0.002 when comparing Cdx2-/- or BrafV600E to Cdx2-/- BrafV600E or Apc+/- Cdx2-/- BrafV600E by log-rank test; p=0.158 when comparing Cdx2-/- BrafV600E to Apc+/- Cdx2-/- BrafV600E by log-rank test. (B) Macroscopic image of the tumors at the proximal colon-cecum-ileum junction of CDX2P-CreERT2 Cdx2fl/fl BrafCA mice. Left: protuberant tumor (T1) located at the proximal colon-cecum-ileum junction; Right: polypoid lesions (T2) that occupied at the entire terminal ileum to cecum region. # indicates the proximal colon; formula image
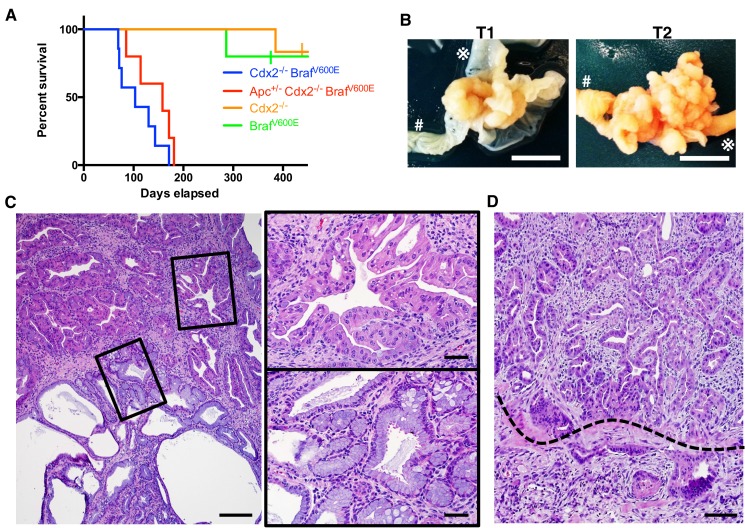
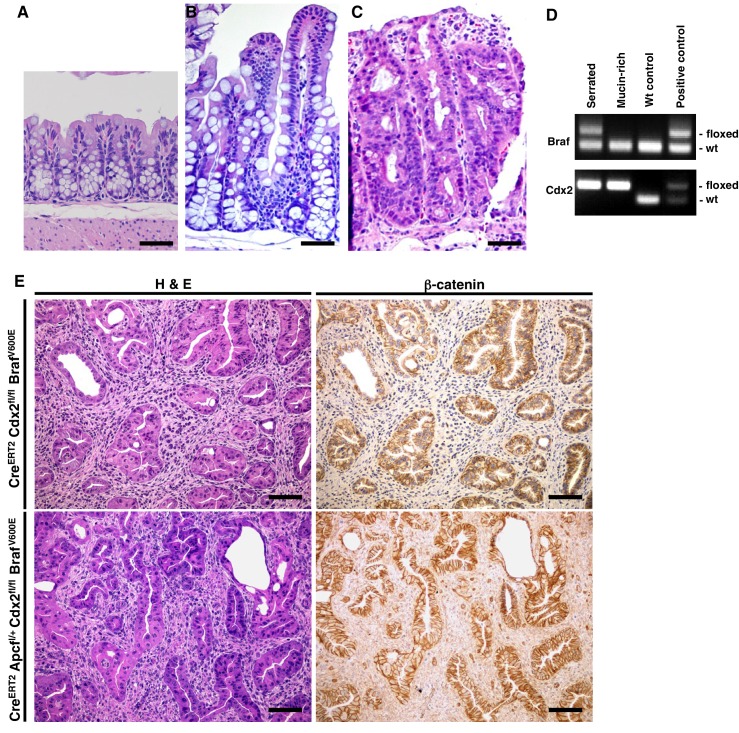
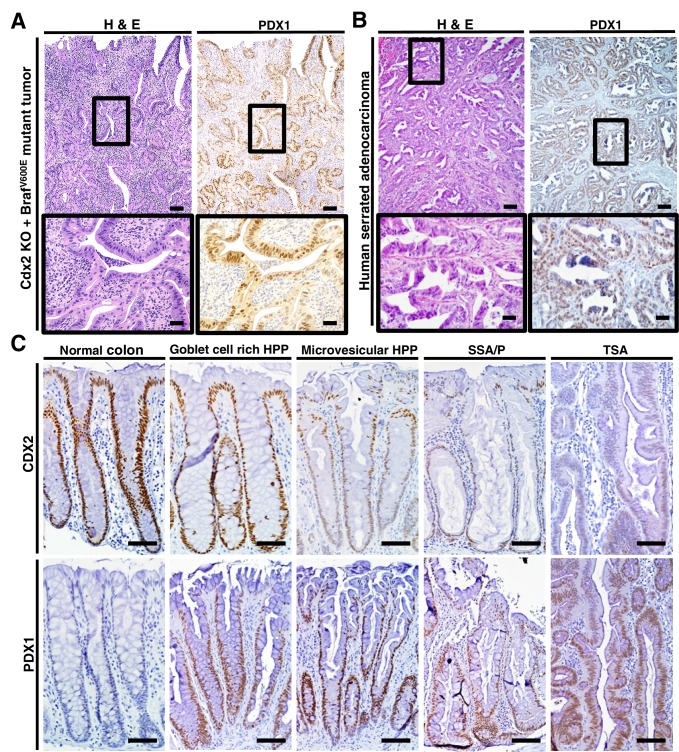
indicates the ileum. Scale bar, 10 mm (C) Histological features of the proximal colon-cecum-ileum junction tumor of CDX2P-CreERT2Cdx2fl/fl BrafCA mice. Two major components were found in the tumor: serrated region (upper right) and mucin-rich region (lower left). Scale bars, 200 μm for low magnification image (left); 50 μm for high magnification images (right). (D) Serrated region showing invasion into submucosa. Dashed-line highlights muscular mucosa. Scale bar, 100 μm. See also Figure 2—source data 1 for panel A. DOI: http://dx.doi.org/10.7554/eLife.20331.007
Figure 2—figure supplement 1.
Figure 2—figure supplement 1.. Combined Cdx2 inactivation and BrafV600E mutation in mouse intestinal epithelium promotes the formation of tumors with serrated morphology.
H and E staining of proximal colon tissues from a wild-type mouse (A), a CDX2P-CreERT2 BrafCA mouse (B) and a CDX2P-CreERT2 Cdx2fl/fl mouse (C) after TAM injection. Scale bars, 100 μm. (D) Genotyping of Braf and Cdx2 in serrated-region and mucin-rich region in the tumor of CDX2-CreERT2 Cdx2fl/fl BrafCA mutant mice using DNA samples obtained by Laser capture microdissection. Only serrated-region had BrafV600E mutation and both regions had Cdx2 loss. (E) Representative H and E (left panels) and immunohistochemical staining for β-catenin (right panels) in a CDX2P-CreERT2Cdx2fl/fl BrafCA mouse 143 days after two daily doses of TAM (upper panels) or a CDX2P-CreERT2 Apcfl/+Cdx2fl/fl BrafCA mouse 114 days after two daily doses of TAM (lower panels). Scale bars, 100 μm. DOI: http://dx.doi.org/10.7554/eLife.20331.010
Figure 3.
Figure 3.. Immunohistochemical (IHC) staining in the tumors at the ileum-cecum junction of CDX2P-CreERT2 Cdx2fl/fl BrafCA mice.
(A) Annexin A10 (left) and phospho-ERK (right) expression in serrated region (upper) and mucin-rich region (lower). Scale bars, 100 μm. (B) H and E (upper left) and IHC staining for CDX2 (upper middle), β-catenin (upper right), BrdU (lower left), p53 (lower middle) and MUC5AC (lower right) at the invasive region of the tumor. Scale bars, 50 μm. DOI: http://dx.doi.org/10.7554/eLife.20331.011
Figure 3—figure supplement 1.
Figure 3—figure supplement 1.. Tumors from CDX2P-CreERT2 Cdx2fl/fl BrafCA mice were MSS, and did not show significant methylation at the p16Ink4a promoter.
(A) Microsatellite analysis of a tumor from a CDX2P-CreERT2 Cdx2fl/fl BrafCA mouse and normal colon tissue was done using five microsatellite repeat markers previously shown to be informative in tumors from DNA mismatch repair–deficient mice. Tumors were scored as MSI if 2 of 5 markers showed instability. (B) Promoter region and coding region (boxed) for p16Ink4a gene were shown in the upper diagram. The 16 CpG dinucleotides are indicated. Genomic DNA from five tumors (T1 to T5) in CDX2P-CreERT2 Cdx2fl/fl BrafCA mice and five normal colon tissues (N1 to N5) were treated with sodium bisulfite. Subsequent PCRs were then performed at the p16Ink4a promoter. Amplified DNA fragments were cloned using the TA Cloning Kit. At least 10 clones were then randomly selected and sequenced for each samples. Solid circles are methylated CpG sites with empty circles showing no methylation. DOI: http://dx.doi.org/10.7554/eLife.20331.012
Figure 3—figure supplement 2.
Figure 3—figure supplement 2.. Expression of intestinal stem cell markers, Wnt target genes and differentiation markers in mice.
RNAs were collected from wild-type (Control), CDX2P-CreERT2 Cdx2fl/fl (Cdx2KO), CDX2P-CreERT2 BrafCA (BrafVE), CDX2P-CreERT2 Cdx2fl/fl BrafCA (Cdx2KOBrafVE), and CDX2P-CreERT2 Apcfl/fl(ApcKO) mice after TAM injection. (A) Expression of intestinal stem cell markers: Olfm4, Lgr5, Msi1, Cd133, Lrig, Hopx, Nkd1 and Bmi1. (B) Expression of Wnt target genes: Cd44, Axin2, Mmp7, EphB2, cMyc and Sox9. (C) Expression of differentiation markers: Muc2, Muc5ac, Anxa10 and Pdx1. Gene expression was assessed by qRT-PCR, with normalization to β-actin expression. RNAs were collected from three mice per group. We fit a one-way ANOVA model with terms for the means of five groups to log-transformed gene expression data, and test differences in means for pairs of groups as well as Braf by Cdx2 interactions by testing if the average difference (of log-transformed data) between Cdx2KO BrafVE samples and BrafVE samples was larger or smaller than the difference between Cdx2KO and control samples, and called the anti-logarithm of this difference-of-differences the ratio of ratios. See also Figure 3—figure supplement 2—source data 1. DOI: http://dx.doi.org/10.7554/eLife.20331.013
Figure 4.
Figure 4.. Activation of EGFR in tumor tissues of CDX2-CreERT2 Cdx2fl/fl BrafCA mice.
Two representative tumors from CDX2-CreERT2 Cdx2fl/fl BrafCA mice (T1 and T2) and cecum tissues from the TAM-treated Cre-negative control mouse (Normal cecum), the CDX2P-CreERT2 Cdx2fl/fl (Cdx2-/-) mouse, or the CDX2P-CreERT2 BrafCA (BrafV600E) mouse were subjected to immunohistochemical (IHC) staining for active EGFR (phospho-EGFR Tyr845). Representative Imagines with low (top panels) and high (bottom panels) magnifications were shown. Scale bars, 100 μm for low magnification image (top); 20 μm for high magnification images (bottom). DOI: http://dx.doi.org/10.7554/eLife.20331.015
Figure 5.
Figure 5.. Global gene expression analyses show strong cooperative interactions of Cdx2 inactivation and BRAFV600E expression in gene regulation in mouse colon.
Global gene expression analyses were performed with RNAs from normal colon epithelium (NC), Cdx2-/--mutant, BrafV600E-mutant, Cdx2-/-BrafV600E-mutant, and Apc-/--mutant colon epithelium. (A) The principal components analysis showed the Cdx2-/- BrafV600E mutant epithelium clearly had distinct global patterns of gene expression from that of normal colon epithelium or mutant colon epithelium of the single mutant genotypes. See also Figure 5–source data 1. (B) Heat map showing the strong cooperative interactions of Cdx2 inactivation and BrafV600E activation in altering the expression of many genes. Genes were sorted by their expression based on the degree of interaction between Cdx2 inactivation and BrafV600E activation. Genes shown are those that gave p<0.01 for the interaction of Cdx2 inactivation and BrafV600E activation (the difference of the Cdx2-/- BrafV600E vs. BrafV600E difference and the Cdx2-/- vs. control difference, in log-space) and that also had the anti-logarithm of the difference of differences at least 10 (or smaller than 1/10) in mouse data. Genes below the dashed line show negative interaction between Cdx2 inactivation and BrafV600E activation. The heat map also showed the comparison of gene expression between the mouse data and human TCGA CRC data. The 18 CRC samples from human TCGA data that had low CDX2 and V600E mutations were compared to the 104 CRC samples with high CDX2 that were not BRAF mutant, and genes were selected with p-values of <0.01 (two-sample T-test) and fold-changes of >1.3 between the two groups. The genes selected by both human and mouse data sets are marked as red. See also Figure 5–source data 2,3. DOI: http://dx.doi.org/10.7554/eLife.20331.016
Figure 6.
Figure 6.. PDX1 expression in tumor tissues of CDX2-CreERT2 Cdx2fl/fl BrafCA mice and human serrated benign tumor tissues.
(A) H and E staining (left) and PDX1 immunohistochemical (IHC) staining in the tumor of CDX2-CreERT2 Cdx2fl/fl BrafCA mice. (B) H and E staining (left) and PDX1 immunohistochemical (IHC) staining in a representative human serrated adenocarcinoma case. Scale bars for panels A and B, 200 μm for low magnification image (top); 50 μm for high magnification images (bottom). (C) Expression pattern of CDX2 and PDX1 in human serrated benign tumors. (Upper panel) CDX2 expression was retained in Goblet cell rich HPP but significantly decreased in all of the other serrated tumors. (Lower panel) Robust aberrant PDX1 expression was seen in all of the serrated tumors, but was absent in normal colon. Scale bars, 50 μm. DOI: http://dx.doi.org/10.7554/eLife.20331.022
Figure 6—figure supplement 1.
Figure 6—figure supplement 1.. Distribution of PDX1 expression in mouse gastrointestinal tract.
(A) In a wild type mouse, only normal tissues from the antrum region of the stomach and the duodenum have strong PDX1 expression. (B) Robust PDX1 expression was seen in the cells at the apical side of the colon of CDX2P-CreERT2 Cdx2fl/fl mice both seven and twenty-one days post TAM injection. Scale bars, 100 μm. DOI: http://dx.doi.org/10.7554/eLife.20331.024
Figure 7.
Figure 7.. Organoids derived from Cdx2-/- and BrafV600E-mutant colon epithelium showed serrated glandular morphology and PDX1 expression.
Organoids were generated from proximal colon of wild-type, CDX2P-CreERT2 Apcfl/fl, CDX2P-CreERT2 Cdx2fl/fl, CDX2P-CreERT2 BrafCA, and CDX2P-CreERT2 Cdx2fl/fl BrafCA mice after TAM injection. Representative organoids from each mouse were shown for H and E (upper panels), and immunohistochemical staining for CDX2 (middle panels) and PDX1 (lower panels). Scale bars, 200 μm for low magnification; 50 μm for high magnification (for H and E). DOI: http://dx.doi.org/10.7554/eLife.20331.025
Figure 8.
Figure 8.. Cooperative effects of CDX2 and BRAF function in regulating gene expression in organoids derived from Cdx2-/- and BrafV600E-mutant colon epithelium.
Organoids were generated from epithelium at proximal colon-cecum junction of wild-type (Control), CDX2P-CreERT2 Cdx2fl/fl (Cdx2KO), CDX2P-CreERT2 BrafCA (BrafVE), and CDX2P-CreERT2 Cdx2fl/fl BrafCA (Cdx2KOBrafVE) mice after 7 days following two daily doses of TAM (150 mg/kg) injection. The organoids were plated in Matrigel for 3 days, and then were treated with DMSO (−) or 6 μM of MEK1/2 inhibitor, AZD6244 (+), daily for two consecutive days before harvest for RNA extraction. Gene expression was assessed by qRT-PCR, with normalization to β-actin expression. Independent RNA samples were prepared from triplicate treatments for each treatment group. (A) Expression of Anxa10, and the genes showing cooperative interactions of CDX2 silencing and BRAFV600E expression in both mouse tissues and organoid system. (B) Expression of the MAPK target genes, Dusp6 and Fos, to show the effectiveness of AZD6244 treatment. (C) We fit a one-way ANOVA model with terms for the means of four groups of genotypes (for both DMSO and AZD6244 treatments) to log-transformed gene expression data, and test differences in means for pairs of groups as well as Braf by Cdx2 interactions by testing if the average difference (of log-transformed data) between Cdx2KO BrafVE samples and BrafVE samples was larger or smaller than the difference between Cdx2KO and control samples, and called the anti-logarithm of this difference-of-differences the ratio of ratios. In addition, we also tested the effects of AZD6244 on gene expression within each genotype groups. See also Figure 8—source data 1. DOI: http://dx.doi.org/10.7554/eLife.20331.026
Figure 8—figure supplement 1.
Figure 8—figure supplement 1.. MAPK activity in organoids was significantly blocked by the treatment with MEK inhibitor, AZD6244.
Organoids were generated from proximal colon-cecum junction of wild-type, CDX2P-CreERT2 Cdx2fl/fl, CDX2P-CreERT2 BrafCA, and CDX2P-CreERT2 Cdx2fl/fl BrafCA mice after 7 days following TAM injection. The organoids were plated in Matrigel for 3 days, and then were treated with vehicle (DMSO) or MEK inhibitor (AZD6244) at 6 μM daily for two consecutive days before harvest for immunohistochemical (IHC) staining for phosphor-ERK. Representative Images with low (upper panels) and high (lower panels) magnifications were shown. Scale bars, 100 μm for low magnification images (upper panels); 20 μm for high magnification images (lower panels). DOI: http://dx.doi.org/10.7554/eLife.20331.028

References

    1. Bacher JW, Abdel Megid WM, Kent-First MG, Halberg RB. Use of mononucleotide repeat markers for detection of microsatellite instability in mouse tumors. Molecular Carcinogenesis. 2005;44:285–292. doi: 10.1002/mc.20146. - DOI - PubMed
    1. Bae JM, Lee TH, Cho NY, Kim TY, Kang GH. Loss of CDX2 expression is associated with poor prognosis in colorectal cancer patients. World Journal of Gastroenterology. 2015;21:1457–1467. doi: 10.3748/wjg.v21.i5.1457. - DOI - PMC - PubMed
    1. Barker N, Huch M, Kujala P, van de Wetering M, Snippert HJ, van Es JH, Sato T, Stange DE, Begthel H, van den Born M, Danenberg E, van den Brink S, Korving J, Abo A, Peters PJ, Wright N, Poulsom R, Clevers H. Lgr5(+ve) stem cells drive self-renewal in the stomach and build long-lived gastric units in vitro. Cell Stem Cell. 2010;6:25–36. doi: 10.1016/j.stem.2009.11.013. - DOI - PubMed
    1. Bateman AC. Pathology of serrated colorectal lesions. Journal of Clinical Pathology. 2014;67:865–874. doi: 10.1136/jclinpath-2014-202175. - DOI - PubMed
    1. Bell SM, Schreiner CM, Wert SE, Mucenski ML, Scott WJ, Whitsett JA. R-spondin 2 is required for normal laryngeal-tracheal, lung and limb morphogenesis. Development. 2008;135:1049–1058. doi: 10.1242/dev.013359. - DOI - PubMed

Publication types