. 2017 Jan 10:8:14014.
doi: 10.1038/ncomms14014.

Agrp neuron activity is required for alcohol-induced overeating

Affiliations

Agrp neuron activity is required for alcohol-induced overeating

Sarah Cains et al. Nat Commun. .

Erratum in

Abstract

Alcohol intake associates with overeating in humans. This overeating is a clinical concern, but its causes are puzzling, because alcohol (ethanol) is a calorie-dense nutrient, and calorie intake usually suppresses brain appetite signals. The biological factors necessary for ethanol-induced overeating remain unclear, and societal causes have been proposed. Here we show that core elements of the brain's feeding circuits-the hypothalamic Agrp neurons that are normally activated by starvation and evoke intense hunger-display electrical and biochemical hyperactivity on exposure to dietary doses of ethanol in brain slices. Furthermore, by circuit-specific chemogenetic interference in vivo, we find that the Agrp cell activity is essential for ethanol-induced overeating in the absence of societal factors, in single-housed mice. These data reveal how a widely consumed nutrient can paradoxically sustain brain starvation signals, and identify a biological factor required for appetite evoked by alcohol.


Conflict of interest statement

The authors declare no competing financial interests.

Figures
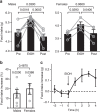
Figure 1
Figure 1. Effect of EtOH on feeding in mice.
(a) Effect of EtOH on daily food intake (one 2 g kg−1 i.p. EtOH injection per day for 3 days; see Methods). Values are averages per mouse per day. Pre=3 days before EtOH, post=3 days after ethanol (mice i.p. injected with saline on non-EtOH days). One-way repeated measures analysis of variance: males, treatment F(2, 10)=21.82, P=0.0002, n=6 mice; females, treatment F(2, 6)=7.628, P=0.0225, n=4 mice. Numbers between bars are P values from Tuckey's multiple comparison corrections. Bars and error brackets are means±s.e.m. (b) EtOH-induced food intake in males versus females from experiment in A. Two-tailed unpaired t-test, t=0.7286, d.f.=8, P value indicated between bars. Numbers above bars are P values from one-sample t-tests: males, t=3.3672, d.f.=5; females, t=3.5242, d.f.=3. Bars and error brackets are means±s.e.m. (c) Food intake induced by EtOH injection (arrowed, 2 g kg−1), shown at hourly time points (n=4 male mice, ‘food intake increase' was calculated by subtracting food intake after saline injection from food intake after EtOH injection, for each mouse and time point). Values are means±s.e.m.
Figure 2
Figure 2. Effects of EtOH on cytosolic biochemical signals of Agrp neurons.
(a) Left, targeting scheme for the GCaMP6s. Centre, localization of GCaMP6s. 3V, third ventricle; Arc, arcuate nucleus; D, dorsal; L, lateral; LH, lateral hypothalamus; M, medial; VMH, ventromedial hypothalamus, V, ventral. Scale bar, 500 μm. Right, GCaMP6s in Agrp cells at higher zoom. Representative example from 10 brains. Scale bar, 30 μm. (b) GCaMP6s response of Agrp cells (n=17) to EtOH (top), corresponding means±s.e.m. (bottom). (c) Relation between EtOH concentration and peak GCaMP6s response of Agrp cells (from experiments such as shown in b), n=12–17 cells for each concentration. One-sample t-tests: 1 mM, t=9.727, d.f.=16; 50 mM, t=8.794, d.f.=11; 100 mM, t=12.64, d.f.=15; ***P<0.0001.
Figure 3
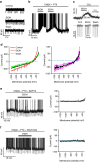
Figure 3. Effects of EtOH on membrane electrical properties of Agrp neurons.
(a) Effect of 50 mM EtOH on spike rate in cell-attached recordings. Representative example of six cells. Firing before EtOH=1.85±0.35 Hz, after=3.72±0.52 Hz, paired t-test: t=4.613, d.f.=5, P=0.0058. (b) Effect of 50 mM EtOH on membrane potential, under synaptic blockade with of 10 μM CNQX and 50 μM PTX. Representative example of eight cells, spikes are truncated at +20 mV. Firing before EtOH 1.07±0.22 Hz, after=7.18±1.58 Hz, paired t-test: t=3.757, d.f.=7, P=0.0071. (c) Effect of 50 mM of EtOH on membrane potential in whole-cell recordings, under synaptic blockade with 1 μM TTX. Top, membrane potential response; Bottom, responses to hyperpolarizing current injections (resting potentials artificially aligned to dotted line to facilitate comparison). Representative example of eight cells. Mean depolarization was 9.38±0.82 mV, one-sample t-test: t=11.4, d.f.=7, P<0.0001. (d) Effect of 50 mM EtOH on whole-cell current–voltage relation. Left, membrane voltage ramps (representative example of 5 cells). Right, net EtOH-induced current (means±s.e.m., n=5 cells). (e) Effect of 50 mM EtOH on membrane potential (left, spikes are truncated at 0 mV), and net EtOH-induced current (right), in the presence of 10 mM intracellular BAPTA. Representative examples of nine cells. Firing before EtOH=0.96±0.21 Hz, after=0.92±0.20 Hz, paired t-test: t=1.110, d.f.=8, P=0.2994. (f) Effect of 50 mM EtOH on membrane potential (left, spikes are truncated at 0 mV), and net EtOH-induced current (right), in the presence of 70 μM KB-R7943. Representative example of n=8 cells. Firing before EtOH=0.64±0.19 Hz, after=0.62±0.17 Hz, paired t-test: t=0.4760, d.f.=7, P=0.6485.
Figure 4
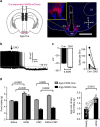
Figure 4. EtOH-induced overeating requires Agrp neuron activity.
(a) Left, targeting scheme for hM4Di-mCherry. Right, localization of hM4Di-mCherry. 3V, third ventricle; Arc, arcuate nucleus; D, dorsal; L, lateral; LH, lateral hypothalamus; M, medial; V: ventral. Inset, hM4Di-mCherry in Agrp cells at higher zoom. Scale bar, 500 μm. Representative example from four brains. (b) Effect of 5μM CNO on Agrp-hM4Di cell firing. Representative example of five cells. (c) Left, group data of membrane potential effect in experiment shown in b (n=5 cells). P value is from a paired t-test, t=6.689, d.f.=4. Right, Spike firing responses in experiment shown in b for all cells. (d) Left, effects of EtOH (2 g kg−1 i.p.) and CNO (5 mg kg−1 i.p.) on food intake of Agrp-Cre mice expressing hM4Di or ChR2 in Agrp cells. Food intake under each drug condition represents a mean of 3 days of drug treatment (same design as in Fig. 1a). Four male mice per group (age/gender-matched littermate pairs). Two-way repeated measures analysis of variance: treatment F(3, 18)=129.9, P<0.0001; genotype F(1, 6)=45.44, P=0.0005; interaction F(3, 18)=53.28, P<0.0001; numbers between bars are P values from Tuckey's multiple comparison corrections. Right, Agrp cell-driven food intake (defined as reduction in food intake evoked by CNO in Agrp-hM4Di mice) in the presence and absence of EtOH (n=8 mice). Number above bars is P value from a two-tailed paired t-test, t=5.055, d.f.=7. Values shown are individual points and/or means±s.e.m.

References

    1. St Diadochos of Photiki. in The Philokalia. Volume 1 (Faber and Faber, New York (1979).
    1. Yeomans M. R. Alcohol, appetite and energy balance: is alcohol intake a risk factor for obesity? Physiol. Behav. 100, 82–89 (2010). - PubMed
    1. Gatineau M. & Mathrani S. Obesity and alcohol: an overview. Available at http://www.noo.org.uk/uploads/doc/vid_14627_Obesity_and_alcohol.pdf (Public Health England, National Obesity Observatory (NOO), 2012).
    1. International Aliance for Responsible Drinking (IARD) Health Review: Drinking and Obesity, 2016. Available at http://www.iard.org/wp-content/uploads/2016/02/HR-Obesity1.pdf.
    1. Eiler W. J. 2nd et al.. The aperitif effect: alcohol's effects on the brain's response to food aromas in women. Obesity 23, 1386–1393 (2015). - PMC - PubMed

Publication types

LinkOut - more resources