Observational Study
. 2017 Jan 10;12(1):e0169593.
doi: 10.1371/journal.pone.0169593. eCollection 2017.

Point-of-Care Versus Central Laboratory Measurements of Hemoglobin, Hematocrit, Glucose, Bicarbonate and Electrolytes: A Prospective Observational Study in Critically Ill Patients

Affiliations
Observational Study

Point-of-Care Versus Central Laboratory Measurements of Hemoglobin, Hematocrit, Glucose, Bicarbonate and Electrolytes: A Prospective Observational Study in Critically Ill Patients

Jérôme Allardet-Servent et al. PLoS One. .

Abstract

Introduction: Rapid detection of abnormal biological values using point-of-care (POC) testing allows clinicians to promptly initiate therapy; however, there are concerns regarding the reliability of POC measurements. We investigated the agreement between the latest generation blood gas analyzer and central laboratory measurements of electrolytes, bicarbonate, hemoglobin, hematocrit, and glucose.

Methods: 314 paired samples were collected prospectively from 51 critically ill patients. All samples were drawn simultaneously in the morning from an arterial line. BD Vacutainer tubes were analyzed in the central laboratory using Beckman Coulter analyzers (AU 5800 and DxH 800). BD Preset 3 ml heparinized-syringes were analyzed immediately in the ICU using the POC Siemens RAPIDPoint 500 blood gas system. We used CLIA proficiency testing criteria to define acceptable analytical performance and interchangeability.

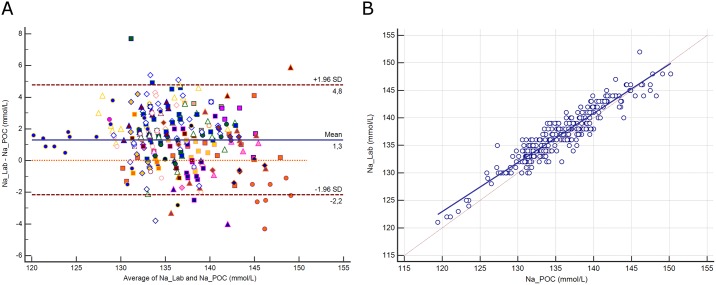
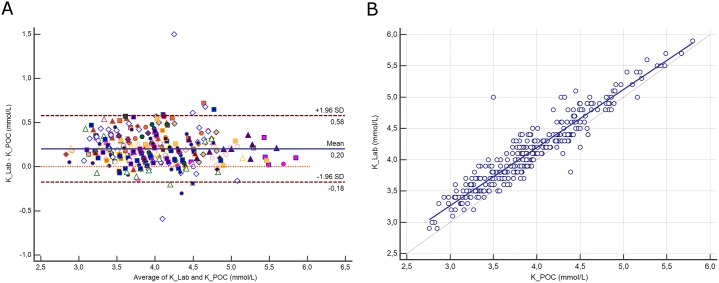
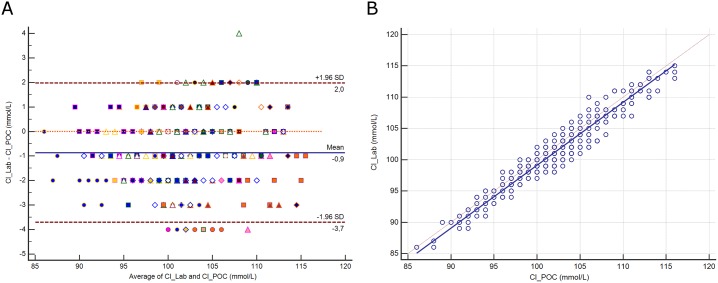
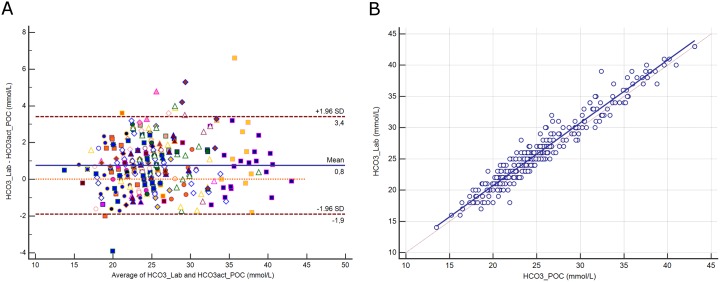
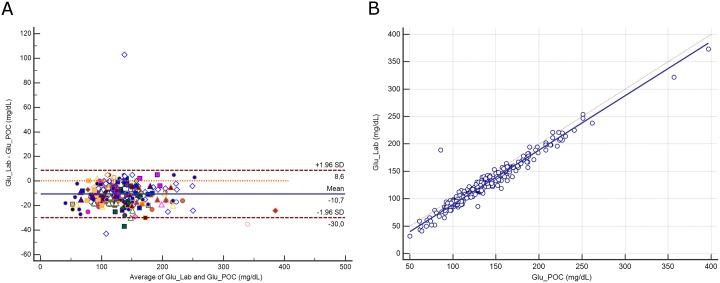
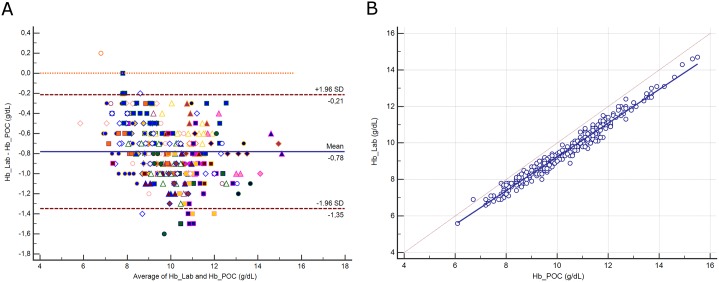
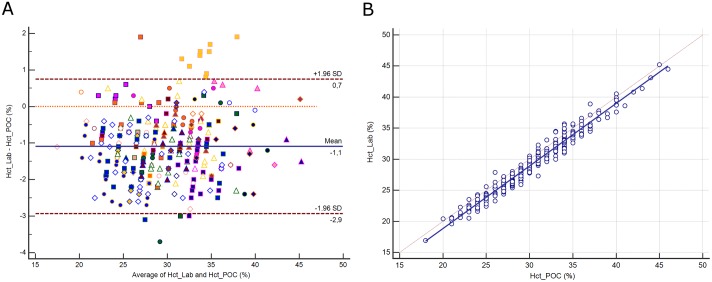
Results: Biases, limits of agreement (±1.96 SD) and coefficients of correlation were respectively: 1.3 (-2.2 to 4.8 mmol/L, r = 0.936) for sodium; 0.2 (-0.2 to 0.6 mmol/L, r = 0.944) for potassium; -0.9 (-3.7 to 2 mmol/L, r = 0.967) for chloride; 0.8 (-1.9 to 3.4 mmol/L, r = 0.968) for bicarbonate; -11 (-30 to 9 mg/dL, r = 0.972) for glucose; -0.8 (-1.4 to -0.2 g/dL, r = 0.985) for hemoglobin; and -1.1 (-2.9 to 0.7%, r = 0.981) for hematocrit. All differences were below CLIA cut-off values, except for hemoglobin.

Conclusions: Compared to central Laboratory analyzers, the POC Siemens RAPIDPoint 500 blood gas system satisfied the CLIA criteria of interchangeability for all tested parameters, except for hemoglobin. These results are warranted for our own procedures and devices. Bearing these restrictions, we recommend clinicians to initiate an appropriate therapy based on POC testing without awaiting a control measurement.


Conflict of interest statement

The authors have declared that no competing interests exist.

Figures

Fig 1
Fig 1
1A. Bland-Altman plot showing the difference versus the average of sodium (Na) measured by the central Lab analyzer and by the POC Siemens RAPIDPoint 500 blood gas system. Bias, upper and lower limits of agreement (±1.96 SD) are represented. The red dotted line indicates equality (difference = 0). There is one marker for each patient. 1B. Scatter diagram showing Deming regression analysis for sodium (Na) measured by the central Lab analyzer and by the POC Siemens RAPIDPoint 500 blood gas system. The regression line (solid line) and the identity line (x = y, dotted line) are represented.
Fig 2
Fig 2
2A. Bland-Altman plot showing the difference versus the average of potassium (K) measured by the central Lab analyzer and by the POC Siemens RAPIDPoint 500 blood gas system. Bias, upper and lower limits of agreement (±1.96 SD) are represented. The red dotted line indicates equality (difference = 0). There is one marker for each patient. 2B. Scatter diagram showing Deming regression analysis for sodium potassium (K) measured by the central Lab analyzer and by the POC Siemens RAPIDPoint 500 blood gas system. The regression line (solid line) and the identity line (x = y, dotted line) are represented.
Fig 3
Fig 3
3A. Bland-Altman plot showing the difference versus the average of chloride (Cl) measured by the central Lab analyzer and by the POC Siemens RAPIDPoint 500 blood gas system. Bias, upper and lower limits of agreement (±1.96 SD) are represented. The red dotted line indicates equality (difference = 0). There is one marker for each patient. 3B. Scatter diagram showing Deming regression analysis for chloride (Cl) measured by the central Lab analyzer and by the POC Siemens RAPIDPoint 500 blood gas system. The regression line (solid line) and the identity line (x = y, dotted line) are represented.
Fig 4
Fig 4
4A. Bland-Altman plot showing the difference versus the average of bicarbonate (HCO3) measured by the central Lab analyzer and by the POC Siemens RAPIDPoint 500 blood gas system. Bias, upper and lower limits of agreement (±1.96 SD) are represented. The red dotted line indicates equality (difference = 0). There is one marker for each patient. 4B. Scatter diagram showing Deming regression analysis for bicarbonate (HCO3) measured by the central Lab analyzer and by the POC Siemens RAPIDPoint 500 blood gas system. The regression line (solid line) and the identity line (x = y, dotted line) are represented.
Fig 5
Fig 5
5A. Bland-Altman plot showing the difference versus the average of glucose (Glu) measured by the central Lab analyzer and by the POC Siemens RAPIDPoint 500 blood gas system. Bias, upper and lower limits of agreement (±1.96 SD) are represented. The red dotted line indicates equality (difference = 0). There is one marker for each patient. 5B. Scatter diagram showing Deming regression analysis for glucose (Glu) measured by the central Lab analyzer and by the POC Siemens RAPIDPoint 500 blood gas system. The regression line (solid line) and the identity line (x = y, dotted line) are represented.
Fig 6
Fig 6
6A. Bland-Altman plot showing the difference versus the average of hemoglobin (Hb) measured by the central Lab analyzer and by the POC Siemens RAPIDPoint 500 blood gas system. Bias, upper and lower limits of agreement (±1.96 SD) are represented. The red dotted line indicates equality (difference = 0). There is one marker for each patient. 6B. Scatter diagram showing Deming regression analysis for hemoglobin (Hb) measured by the central Lab analyzer and by the POC Siemens RAPIDPoint 500 blood gas system. The regression line (solid line) and the identity line (x = y, dotted line) are represented.
Fig 7
Fig 7
7A. Bland-Altman plot showing the difference versus the average of hematocrit (Hct) measured by the central Lab analyzer and by the POC Siemens RAPIDPoint 500 blood gas system. Bias, upper and lower limits of agreement (±1.96 SD) are represented. The red dotted line indicates equality (difference = 0). There is one marker for each patient. 7B. Scatter diagram showing Deming regression analysis for hematocrit (Hct) measured by the central Lab analyzer and by the POC Siemens RAPIDPoint 500 blood gas system. The regression line (solid line) and the identity line (x = y, dotted line) are represented.

References

    1. Lee JW: Fluid and electrolyte disturbances in critically ill patients. Electrolyte Blood Press 2011; 8:72–81 - PMC - PubMed
    1. Moritz ML, Ayus JC: Maintenance Intravenous Fluids in Acutely Ill Patients. N Engl J Med 2015; 373:1350–60 10.1056/NEJMra1412877 - DOI - PubMed
    1. Buckley MS, Leblanc JM, Cawley MJ: Electrolyte disturbances associated with commonly prescribed medications in the intensive care unit. Crit Care Med 2010; 38:S253–64 10.1097/CCM.0b013e3181dda0be - DOI - PubMed
    1. Kost GJ, Ehrmeyer SS, Chernow B, Winkelman JW, Zaloga GP, Dellinger RP, et al.: The laboratory-clinical interface: point-of-care testing. Chest 1999; 115: 1140–54 - PubMed
    1. Lee-Lewandrowski E, Lewandrowski K: Perspectives on cost and outcomes for point-of-care testing. Clin Lab Med 2009; 29:479–89 10.1016/j.cll.2009.07.001 - DOI - PubMed

Publication types