

Socioeconomic Inequalities in Body Mass Index across Adulthood: Coordinated Analyses of Individual Participant Data from Three British Birth Cohort Studies Initiated in 1946, 1958 and 1970
- PMID: 28072856
- PMCID: PMC5224787
- DOI: 10.1371/journal.pmed.1002214
Socioeconomic Inequalities in Body Mass Index across Adulthood: Coordinated Analyses of Individual Participant Data from Three British Birth Cohort Studies Initiated in 1946, 1958 and 1970
Abstract
Background: High body mass index (BMI) is an important contributor to the global burden of ill-health and health inequality. Lower socioeconomic position (SEP) in both childhood and adulthood is associated with higher adult BMI, but how these associations have changed across time is poorly understood. We used longitudinal data to examine how childhood and adult SEP relates to BMI across adulthood in three national British birth cohorts.
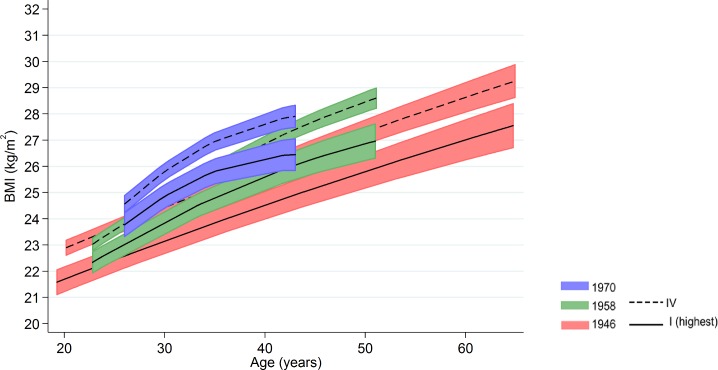
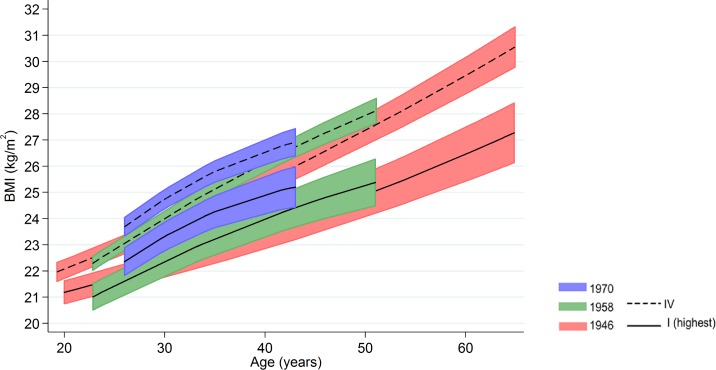
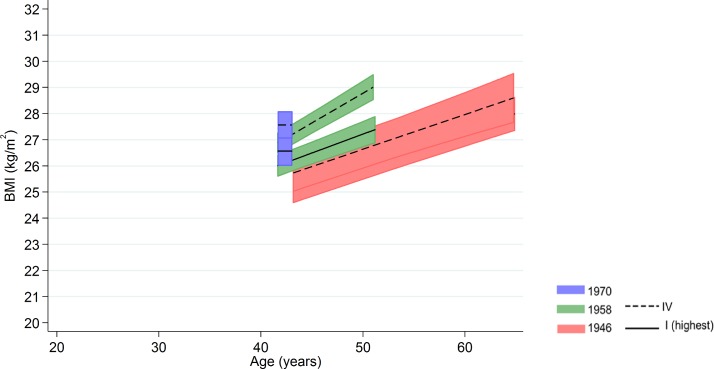
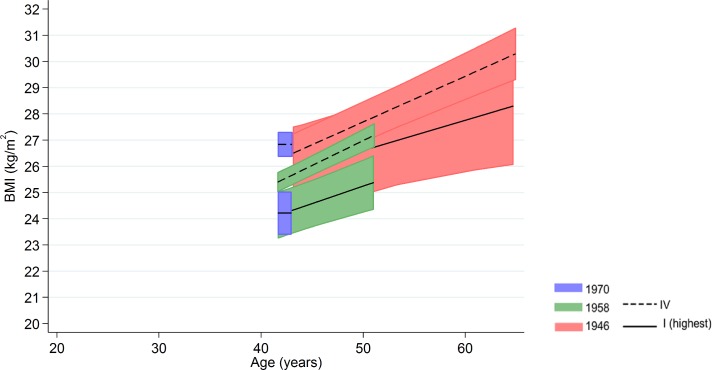
Methods and findings: The sample comprised up to 22,810 participants with 77,115 BMI observations in the 1946 MRC National Survey of Health and Development (ages 20 to 60-64), the 1958 National Child Development Study (ages 23 to 50), and the 1970 British Cohort Study (ages 26 to 42). Harmonized social class-based SEP data (Registrar General's Social Class) was ascertained in childhood (father's class at 10/11 y) and adulthood (42/43 years), and BMI repeatedly across adulthood, spanning 1966 to 2012. Associations between SEP and BMI were examined using linear regression and multilevel models. Lower childhood SEP was associated with higher adult BMI in both genders, and differences were typically larger at older ages and similar in magnitude in each cohort. The strength of association between adult SEP and BMI did not vary with age in any consistent pattern in these cohorts, but were more evident in women than men, and inequalities were larger among women in the 1970 cohort compared with earlier-born cohorts. For example, mean differences in BMI at 42/43 y amongst women in the lowest compared with highest social class were 2.0 kg/m2 (95% CI: -0.1, 4.0) in the 1946 NSHD, 2.3 kg/m2 (1.1, 3.4) in the 1958 NCDS, and 3.9 kg/m2 (2.3, 5.4) the in the 1970 BCS; mean (SD) BMI in the highest and lowest social classes were as follows: 24.9 (0.8) versus 26.8 (0.7) in the 1946 NSHD, 24.2 (0.4) versus 26.5 (0.4) in the 1958 NCDS, and 24.2 (0.3) versus 28.1 (0.8) in the 1970 BCS. Findings did not differ whether using overweight or obesity as an outcome. Limitations of this work include the use of social class as the sole indicator of SEP-while it was available in each cohort in both childhood and adulthood, trends in BMI inequalities may differ according to other dimensions of SEP such as education or income. Although harmonized data were used to aid inferences about birth cohort differences in BMI inequality, differences in other factors may have also contributed to findings-for example, differences in missing data.
Conclusions: Given these persisting inequalities and their public health implications, new and effective policies to reduce inequalities in adult BMI that tackle inequality with respect to both childhood and adult SEP are urgently required.
Conflict of interest statement
The authors have declared that no competing interests exist.
Figures
References
-
- Ng M, Fleming T, Robinson M, Thomson B, Graetz N, Margono C, et al. Global, regional, and national prevalence of overweight and obesity in children and adults during 1980–2013: a systematic analysis for the Global Burden of Disease Study 2013. Lancet. 2014;384(9945):766–81. 10.1016/S0140-6736(14)60460-8 - DOI - PMC - PubMed
-
- Finucane MM, Stevens GA, Cowan MJ, Danaei G, Lin JK, Paciorek CJ, et al. National, regional, and global trends in body-mass index since 1980: systematic analysis of health examination surveys and epidemiological studies with 960 country-years and 9.1 million participants. Lancet. 2012;377(9765):557–67. - PMC - PubMed
MeSH terms
Grants and funding
LinkOut - more resources
Full Text Sources
Other Literature Sources
