. 2017 Jan 9;31(1):50-63.
doi: 10.1016/j.ccell.2016.12.002.

Epigenetic siRNA and Chemical Screens Identify SETD8 Inhibition as a Therapeutic Strategy for p53 Activation in High-Risk Neuroblastoma

Affiliations

Epigenetic siRNA and Chemical Screens Identify SETD8 Inhibition as a Therapeutic Strategy for p53 Activation in High-Risk Neuroblastoma

Veronica Veschi et al. Cancer Cell. .

Abstract

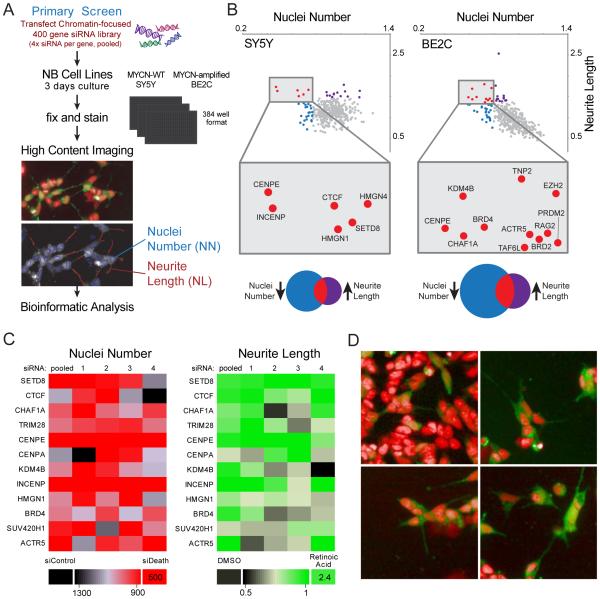
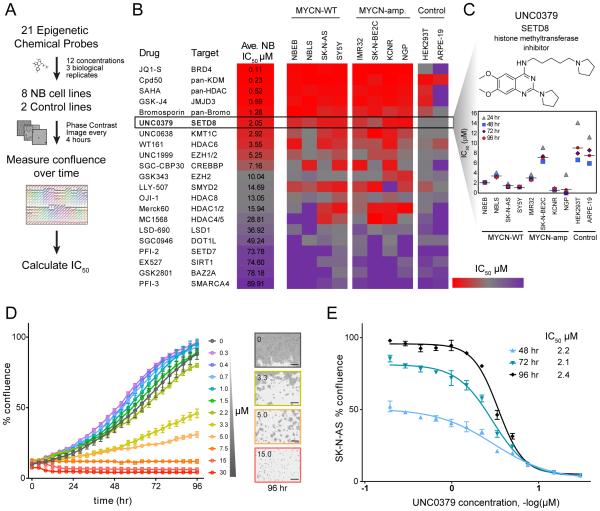
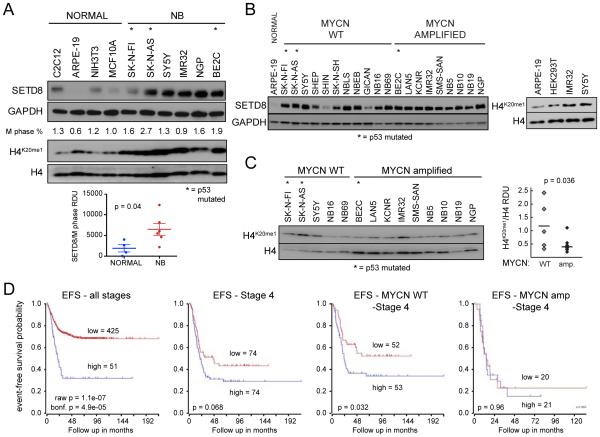
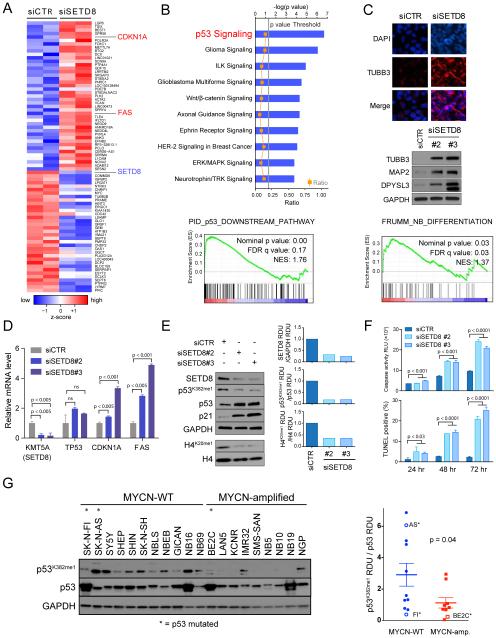
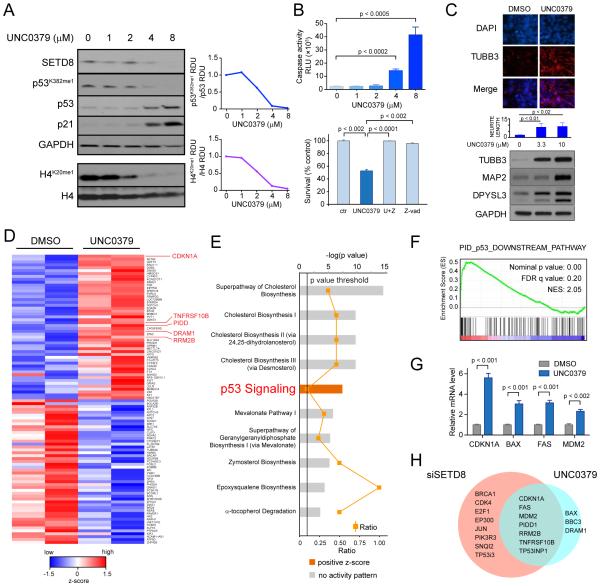
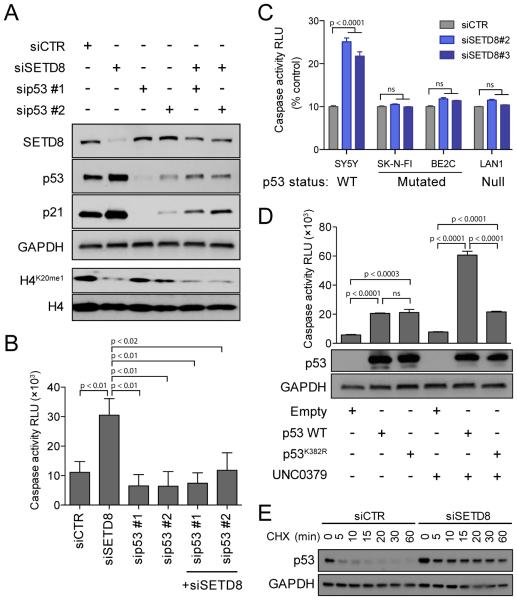
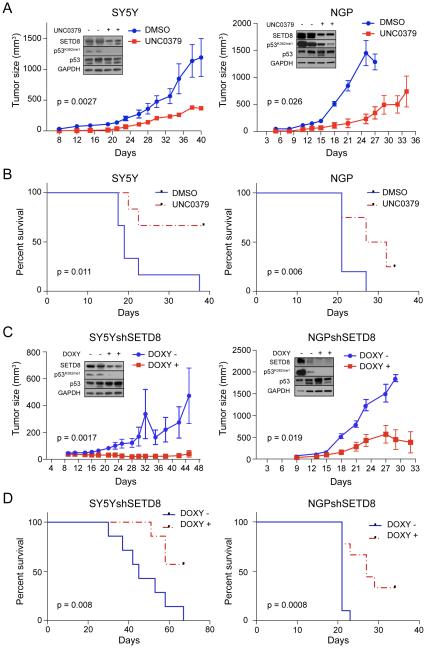
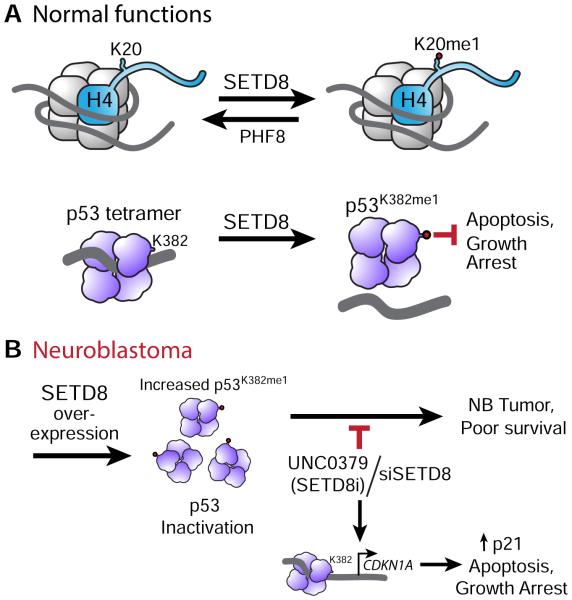
Given the paucity of druggable mutations in high-risk neuroblastoma (NB), we undertook chromatin-focused small interfering RNA and chemical screens to uncover epigenetic regulators critical for the differentiation block in high-risk NB. High-content Opera imaging identified 53 genes whose loss of expression led to a decrease in NB cell proliferation and 16 also induced differentiation. From these, the secondary chemical screen identified SETD8, the H4K20me1 methyltransferase, as a druggable NB target. Functional studies revealed that SETD8 ablation rescued the pro-apoptotic and cell-cycle arrest functions of p53 by decreasing p53K382me1, leading to activation of the p53 canonical pathway. In pre-clinical xenograft NB models, genetic or pharmacological (UNC0379) SETD8 inhibition conferred a significant survival advantage, providing evidence for SETD8 as a therapeutic target in NB.

Keywords: SETD8; differentiation; epigenetics; neuroblastoma; p53; siRNA screen.


Figures

Figure 1
Figure 1. Epigenetic focused high-throughput RNAi screen of NB cells reveals 16 vulnerability genes
(A) A flow chart of the high-throughput imaging assay identified key steps. A library of siRNAs against ~400 chromatin-focused genes was reverse transfected into NB cell lines. After 3 days of culture, the cells were fixed and stained. A high-throughput imaging assay was used to determine nuclei number (NN) and neurite length (NL). NB cells driven to differentiate by retinoic acid treatment (upper panel) were visualized using stably expressed GFP and a nuclear stain (Hoechst 33342). Nuclei (blue outline) and neurite outgrowths (red line segment) were detected by an automated image analysis algorithm (lower panel). (B) Scatter plots showing statistically significant genes in SY5Y (left panel) and SK-N-BE2C (right panel). siRNAs that met both parameters: decrease of NN and increase of NL (red dots). Venn diagrams showing statistically significant genes for which siRNAs decreased NN (blue) or increased NL (purple) or both (red). (C) Heatmaps showing the results of the secondary screen performed with a siRNAs library with 4 deconvoluted sequences and smartpool siRNAs (pooled): 12 statistically significant genes were analyzed in SY5Y on the basis of NN (red heatmap) and NL (green heatmap). The positive controls used were an siRNA that induced cell death (NN) and retinoic acid (NL). (D) Stably expressed GFP and Hoechst 33342 (pseudocolored as red) were used to label SY5Y cells. Representative images show effects on cell number and morphology after silencing of CENPE, SETD8 and BRD4 compared with non-targeting siRNA. See also Tables S1, S2 and S3 and Figure S1.
Figure 2
Figure 2. Chemical screen of 21 epigenetic probes identifies SETD8 inhibitor as one of the top compounds with the lowest IC50
(A) Flow chart of the chemical screen: 21 epigenetic probes were tested in the indicated cell lines and images were recorded by an IncuCyte Zoom System in order to calculate IC50. (B) Heatmap showing the average IC50 of the indicated epigenetic chemical probes at 96 hr in 4 MYCN-WT and 4 MYCN-amp NB cell lines compared to 2 control cell lines (ARPE-19 and 293T). The color key represents the average IC50 (μM) values: red color indicates low IC50 whereas purple color represents high IC50. Cell confluence was recorded by an IncuCyte Zoom System. The average IC50 was calculated based on the cell confluence values of 3 biological replicates across 8 NB cell lines at 96 hr using GraphPad Prism. For in vitro therapeutic index (IVTI) and p values, see Figure S2 and Table S4. (C) In vitro UNC0379 treatment of NB cell lines and control cell lines ARPE-19 and 293T (average of 3 biological replicates). (D, E) A representative experiment showing effects of in vitro treatment of SK-N-AS cells with UNC0379 at indicated times (D) and concentrations (E). Bars show the average of 3 replicates ± SD. In panel (D) the images were captured by IncuCyte Zoom. Scale bars, 300 μm. See also Table S4 and Figure S2.
Figure 3
Figure 3. SETD8 is overexpressed in NB cells and high SETD8 expression associated with worse prognosis in MYCN-WT tumors
(A) Immunoblots show SETD8 and H4K20me1 levels in NB cells compared with control cells. SETD8 protein levels normalized to M phase % in NB compared to normal cells were calculated as RDU (Relative Densitometric Unit, p = 0.04). Bars show the mean ± SEM. (B) Immunoblot showing SETD8 protein levels in MYCN-WT and MYCN-amp NB cells. (C) Western blot (left) and densitometric analysis (right) of H4K20me1 protein levels normalized to H4 protein levels in 14 NB cell lines were calculated as RDU (p = 0.036) using Image J Software. (D) Kaplan-Meier plots based on the expression of SETD8 tumors from NB patients at all stages (left panel) or in tumors from stage 4 (middle left panel) NB patients (R2 database: Kocak raw p = 1.1e-07 bonf p = 4.9e-05; p = 0.068). Kaplan-Meier plots based on the expression of SETD8 in MYCN-WT (middle right panel) or MYCN-amp (right panel) tumors from stage 4 NB patients (R2 database: Kocak n = 105, MYCN-WT, stage 4 NB tumors, p = 0.032; n = 41, MYCN-amp, stage 4 NB tumors, p = 0.96). See also Figure S3.
Figure 4
Figure 4. Genetic inhibition of SETD8 leads to activation of the p53 canonical pathway by decreased p53K382me1 levels
(A) Heatmap showing the top up- and down-regulated genes ranked by statistical significance following 36 hr of SETD8 silencing in SY5Y cells. Data are presented as normalized expression values of 2 biological replicates based on edgeR software analysis and FDR < 0.001. The color key represents the normalized expression values: blue (low) to red (high). (B) The top ten differentially expressed canonical pathways after SETD8 silencing in SY5Y cells defined by IPA (Ingenuity pathway analysis) based on edgeR software analysis and FDR < 0.001 (upper panel). GSEA (Gene Set Enrichment Analysis) of the p53 downstream pathway (lower panel, nominal p value = 0.00, FDR = 0.17, NES = 1.76) after SETD8 silencing. (C) Immunofluorescence analysis showing the expression of TUBB3 (red) after SETD8 silencing for 72 hr in SY5Y cells counter-stained with DAPI (blue). Scale bars, 100 μm (upper panel). Immunoblot of proteins from SY5Y cells 72 hr after transfection with control siRNA and SETD8 siRNAs and blotted with antibodies detecting TUBB3, MAP2 and DPYSL3 proteins (middle panel). GSEA of the FRUMM NB differentiation signature (lower panel, nominal p value = 0.03, FDR = 0.03, NES = 1.37) after SETD8 silencing. (D) qRT-PCR analysis showing relative mRNA levels of the indicated genes after SETD8 silencing for 36 hr. Bars show the mean ± SEM of 3 replicates. (E) Immunoblot analysis of SY5Y (MYCN-WT) cells upon treatment with either of 2 different siRNAs targeting SETD8 for 72 hr. Densitometric analysis of SETD8 protein levels normalized to GAPDH (upper right panel), of p53K382me1 protein levels normalized to p53 (middle right panel) and of H4K20me1 protein levels normalized to H4 (lower right panel) after SETD8 silencing calculated as RDU using Image J Software. (F) Caspase 3/7 activity and number of TUNEL positive cells upon SETD8 silencing in SY5Y cells. Bars show the average of 3 replicates ± SD. (G) Immunoblot (left) and densitometric analysis (right) of p53K382me1 protein levels normalized to p53 protein levels in 20 NB cell lines were calculated as RDU (p = 0.04) using Image J Software. Bars show the mean ± SEM. See also Tables S5, S6 and S7 and Figure S4.
Figure 5
Figure 5. SETD8 pharmacological inhibition reduces cell growth and activates p53 proapoptotic and growth arrest functions in SY5Y cells
(A) Western blot of SY5Y (MYCN-WT) cells treated with UNC0379 at the indicated concentrations (left panel). Densitometric analysis of p53K382me1 levels normalized to p53 protein levels (upper right) and of H4K20me1 levels normalized to H4 protein levels (lower right) after treatment with the SETD8 inhibitor, UNC0379, for 12 hr calculated as RDU using Image J Software. (B) Caspase 3/7 activity upon SETD8 pharmacological inhibition for 12 hr in SY5Y cells. Bars show the mean ± SD of 3 replicates (upper graph). The effects of caspase inhibitor Z-VAD-FMK on UNC0379 treated SY5Y cells (lower graph). SY5Y cells were pretreated with 10 μM Z-VAD for 3 hr, followed by treatment with 10 μM UNC0379 for 48 hr, or treated with UNC0379 or Z-VAD alone for 48 hr. MTS assay was used to detect cell survival. Data represent mean ± SD of 2 independent experiments (p < 0.001). (C) Immunofluorescence analysis showing the expression of TUBB3 (red) after treatment with 4 μM UNC0379 for 72 hr in SY5Y cells. Nuclei are stained with DAPI (blue). Scale bars, 100 μm (upper panel). Neurite length in SY5Y treated with 3.3 μM and 10 μM UNC0379 for 72 hr, measured by the Opera microscope. Bars represent the mean ± SD of 3 replicates (middle panel). Immunoblot of proteins from SY5Y cells treated with 3.3 μM and 10 μM UNC0379 for 72 hr and immunoblotted with antibodies to TUBB3, MAP2 and DPYSL3 (lower panel). (D) Heatmap of the top 50 up- and down-regulated genes in SY5Y cells ranked by statistical significance following 12 hr of treatment with 4 μM (IC80) UNC0379. Data are presented as normalized expression values of 2 biological replicates based on edgeR software analysis and FDR < 0.001. The color key represents the normalized expression values: blue (high) to red (low). (E) The top ten differentially expressed canonical pathways after SETD8 pharmacological inhibition defined by IPA (Ingenuity pathway analysis) based on edgeR software analysis and FDR < 0.001. Pathways related to p53 signaling are among top differentially expressed pathways. (F) GSEA of the p53 downstream pathway (Nominal p value = 0.00, FDR = 0.20, NES = 2.05) after UNC0379 treatment. (G) qRT-PCR analysis showing relative mRNA levels of the indicated genes after SETD8 pharmacological inhibition. Bars show mean ± SEM of 3 replicates. (H) Venn diagram showing numbers of differentially expressed p53 target genes from genetic and pharmacological inhibition of SETD8. See also Tables S5 and S6 and Figure S5.
Figure 6
Figure 6. SETD8 inhibition-mediated cell death is p53 dependent
(A) Immunoblot analysis showing p53 and/or SETD8 protein levels upon treatment with 2 different siRNAs targeting p53 alone or in combination with siSETD8 #3 for 48 hr in SY5Y cells. (B) Caspase 3/7 activity calculated as RLU (Relative Luminescence Unit) upon treatment with 2 different siRNAs targeting p53 alone or in combination with siSETD8 #3 for 72 hr in SY5Y cells. Data represent mean ± SD of 2 independent experiments (p < 0.001). (C) Caspase 3/7 activity calculated as RLU after SETD8 knockdown for 72 hr in two p53 mutated (SK-N-FI and BE2C) and in one p53 null (LAN1) NB cells compared with p53 WT SY5Y. Data represent mean ± SD of 2 independent experiments (p <0.001). (D) Caspase 3/7 activity calculated as RLU with overexpression of p53 WT or p53K382R and treatment with UNC0379 8 μM for 24 hr in LAN1, p53 null NB cells. Data represent mean ± SD of 2 independent experiments (p < 0.001) (upper panel). Immunoblot analysis showing p53 levels under indicated conditions (lower panel). (E) Immunoblot analysis for p53 with siCTR or siSETD8 in SY5Y cells. Cells were collected after treatment with 50 μg/ml CHX at the indicated time. See also Figure S6.
Figure 7
Figure 7. Genetic and pharmacological inhibition of SETD8 impairs tumor growth and prolongs murine survival in in vivo model of NB
(A) SY5Y (left) and NGP (right) cells were treated ex-vivo for 24 hr with 2 μM UNC0379, SETD8 inhibitor, and then injected into nude mice. Day 0 indicates the day of cell implantation. Immunoblot of proteins from 2 tumors randomly chosen from each group (untreated and ex-vivo UNC0379 treated) collected 20 days after the injection and blotted with antibodies to SETD8, p53K382me1, p53 and GAPDH (insets). Bars show the tumor size average of 15 mice/group ± SEM. Slopes of the growth rate were compared by t test. (B) Kaplan-Meier graphs showing the murine survival upon ex-vivo treatment of SY5Y (left) and NGP (right) with UNC0379. The statistical significance between 2 treatment groups was evaluated using a log-rank test. (C) SY5Y-NB (left) and NGP-NB (right) xenograft tumor size in mice treated with doxycycline (DOXY) after tumors reached 75-100 mm3. Day 0 indicates the day of cell implantation. After 9 days, mice were divided in 2 groups: untreated and doxy-treated. Immunoblot of proteins from 2 tumors randomly chosen from each group 20 days after the injection and blotted with antibodies to SETD8, p53K382me1, p53 and GAPDH (insets). Bars show the tumor size average of 15 mice/group ± SEM. Slopes of the growth rate were compared by t test. (D) Kaplan-Meier graphs showing the murine survival upon SETD8 silencing in SY5Y-NB (left) and NGP-NB (right) tumor bearing mice. The statistical significance between 2 treatment groups was evaluated using a log-rank test. See also Figure S7.
Figure 8
Figure 8. Model of SETD8 normal function and role in NB
(A) Model showing H4K20me1 and p53K382me1 as major targets of SETD8. Monomethylation of p53 K382 by SETD8 attenuates p53 proapoptotic and growth arrest function. (B) In NB, SETD8 may be overexpressed, resulting in increased levels of p53K382me1 and inactivation of p53. Genetic or pharmacologic inhibition of SETD8 rescues p53 function by decreasing p53K382me1 and activating p53 canonical pathways.

References

    1. Alexandrov LB, Nik-Zainal S, Wedge DC, Aparicio SA, Behjati S, Biankin AV, Bignell GR, Bolli N, Borg A, Borresen-Dale AL, et al. Signatures of mutational processes in human cancer. Nature. 2013;500:415–421. - PMC - PubMed
    1. Arrowsmith CH, Bountra C, Fish PV, Lee K, Schapira M. Epigenetic protein families: a new frontier for drug discovery. Nat Rev Drug Discov. 2012;11:384–400. - PubMed
    1. Bagatell R, Beck-Popovic M, London WB, Zhang Y, Pearson AD, Matthay KK, Monclair T, Ambros PF, Cohn SL. Significance of MYCN amplification in international neuroblastoma staging system stage 1 and 2 neuroblastoma: a report from the International Neuroblastoma Risk Group database. J Clin Oncol. 2009;27:365–370. - PMC - PubMed
    1. Balamuth NJ, Wood A, Wang Q, Jagannathan J, Mayes P, Zhang Z, Chen Z, Rappaport E, Courtright J, Pawel B, et al. Serial transcriptome analysis and cross-species integration identifies centromere-associated protein E as a novel neuroblastoma target. Cancer Res. 2010;70:2749–2758. - PMC - PubMed
    1. Barbieri E, De Preter K, Capasso M, Chen Z, Hsu DM, Tonini GP, Lefever S, Hicks J, Versteeg R, Pession A, et al. Histone chaperone CHAF1A inhibits differentiation and promotes aggressive neuroblastoma. Cancer Res. 2014;74:765–774. - PubMed

MeSH terms

Substances