. 2017 Jan 9;31(1):79-93.
doi: 10.1016/j.ccell.2016.11.001.

BCL9L Dysfunction Impairs Caspase-2 Expression Permitting Aneuploidy Tolerance in Colorectal Cancer

Affiliations

BCL9L Dysfunction Impairs Caspase-2 Expression Permitting Aneuploidy Tolerance in Colorectal Cancer

Carlos López-García et al. Cancer Cell. .

Abstract

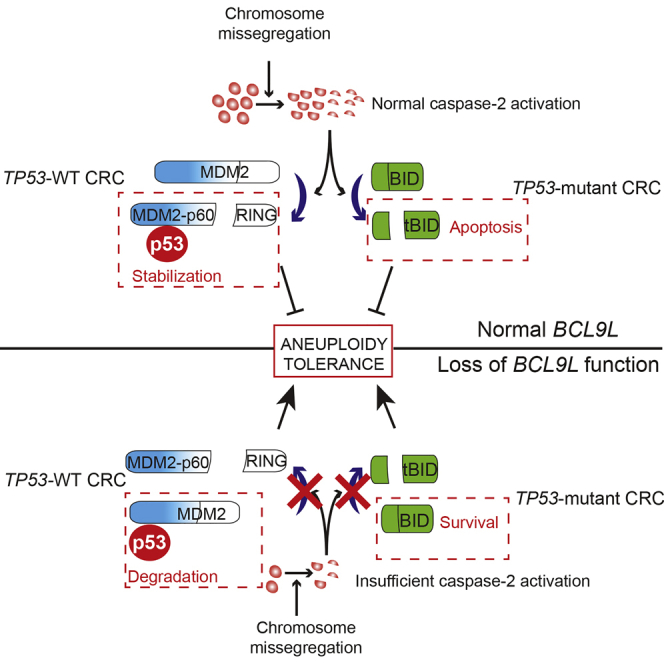
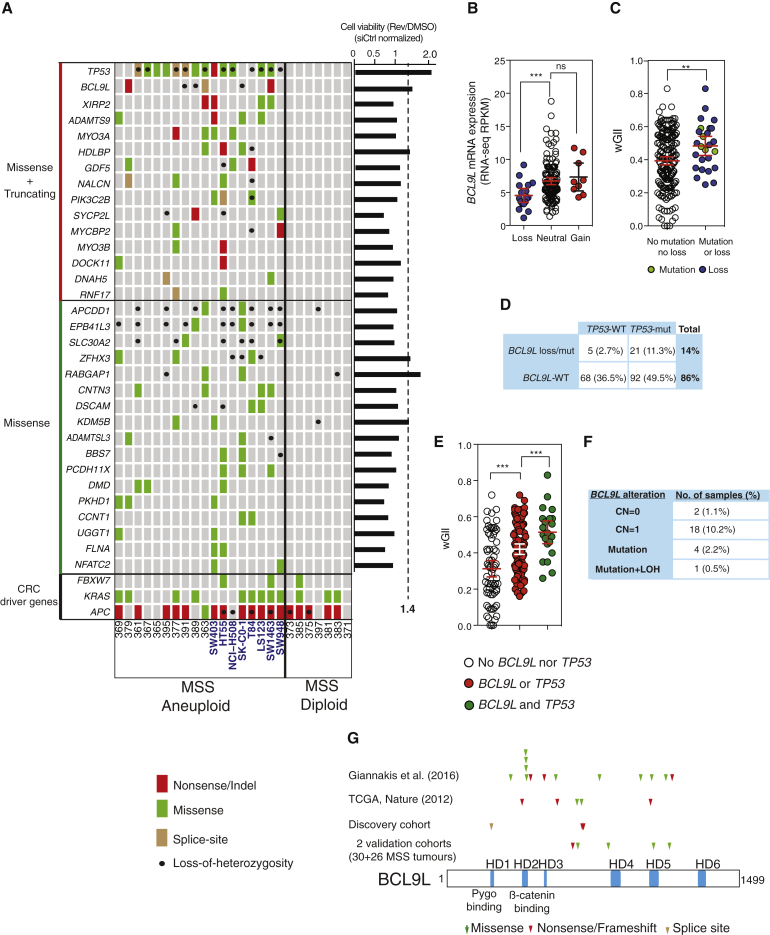
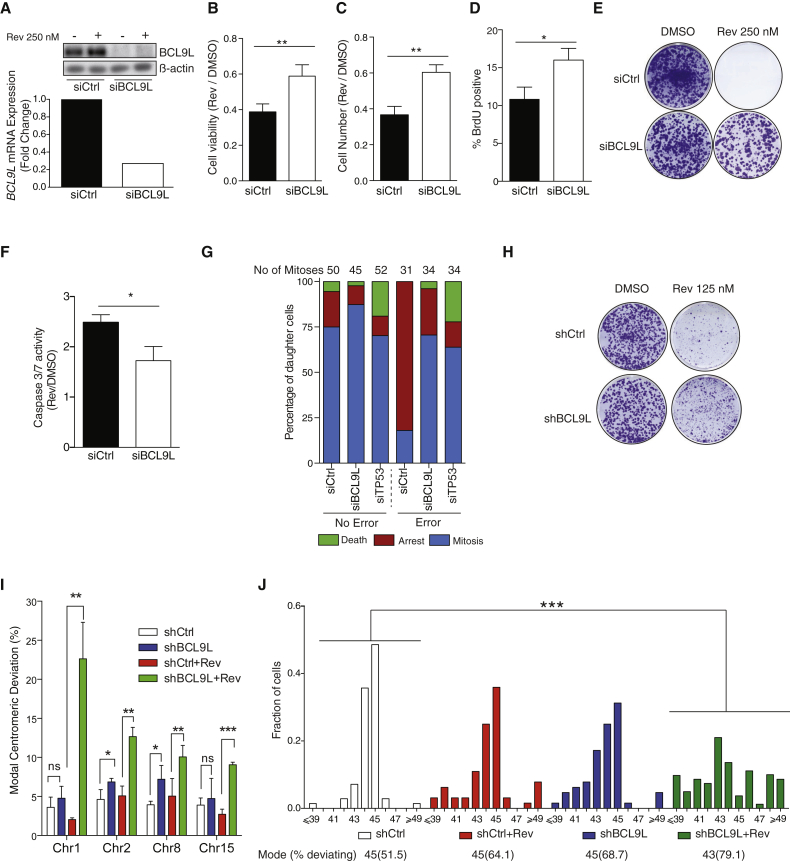
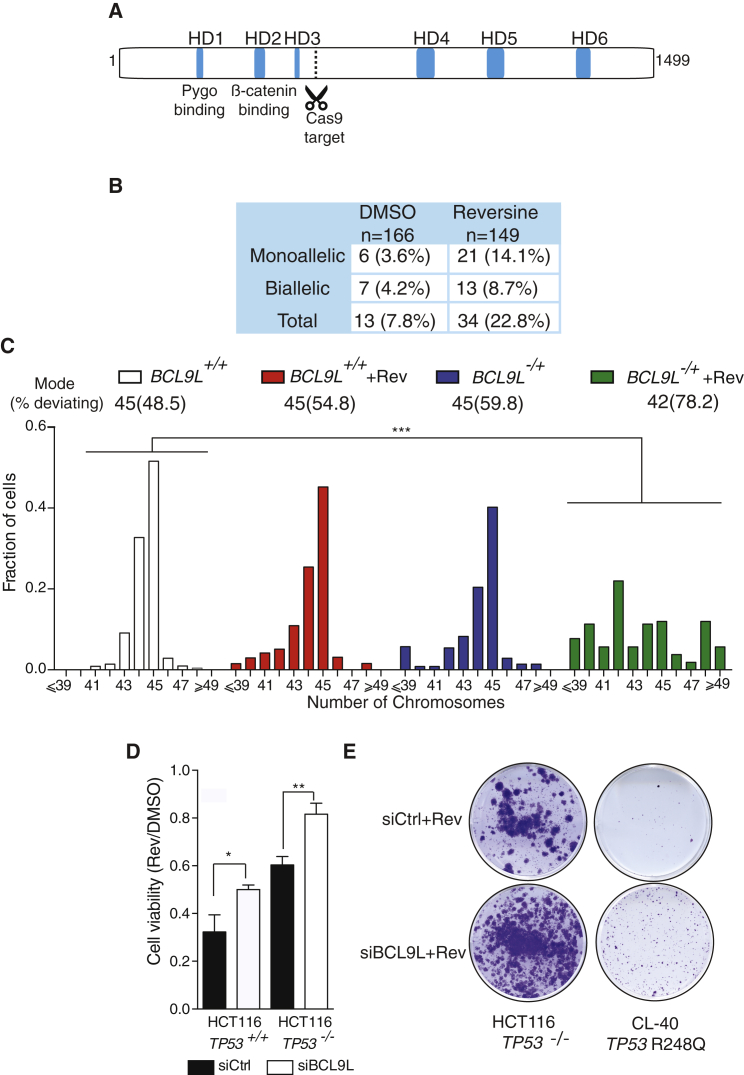
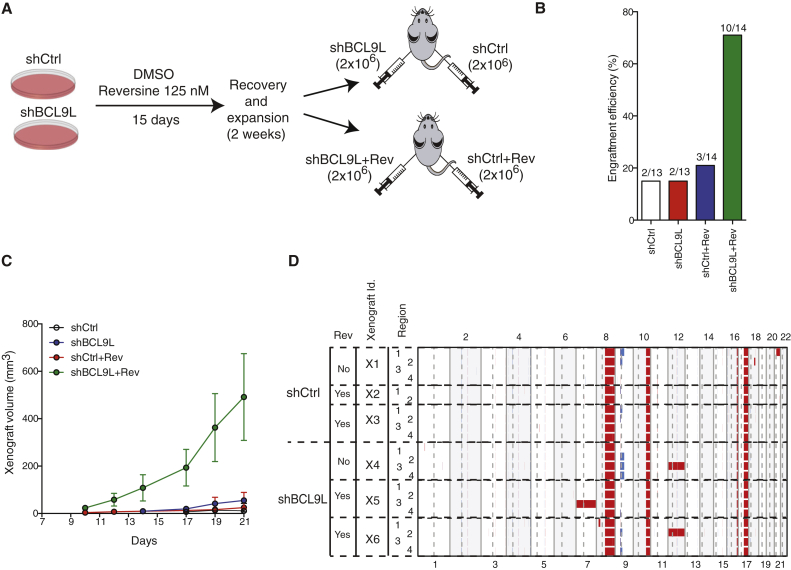
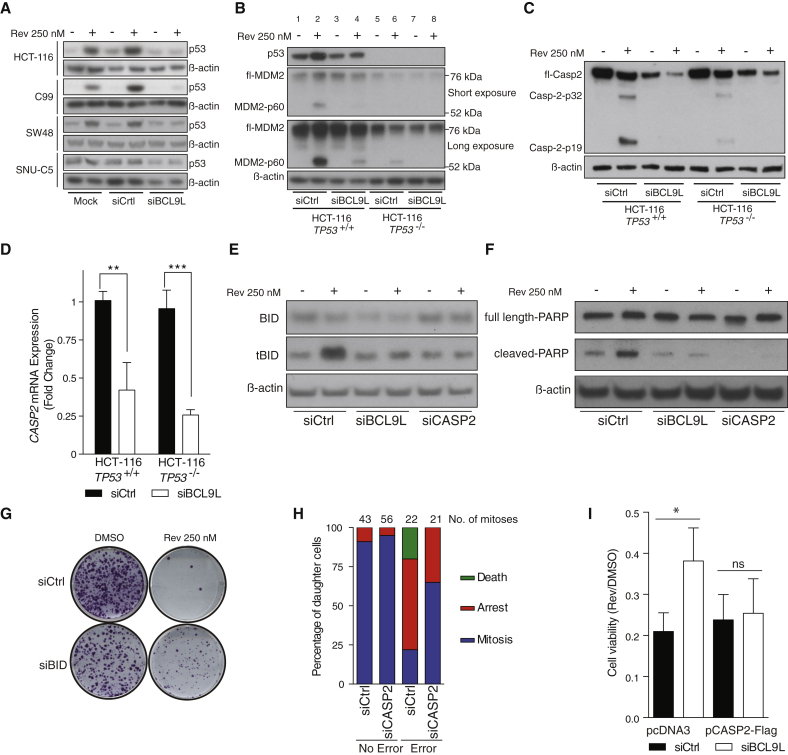
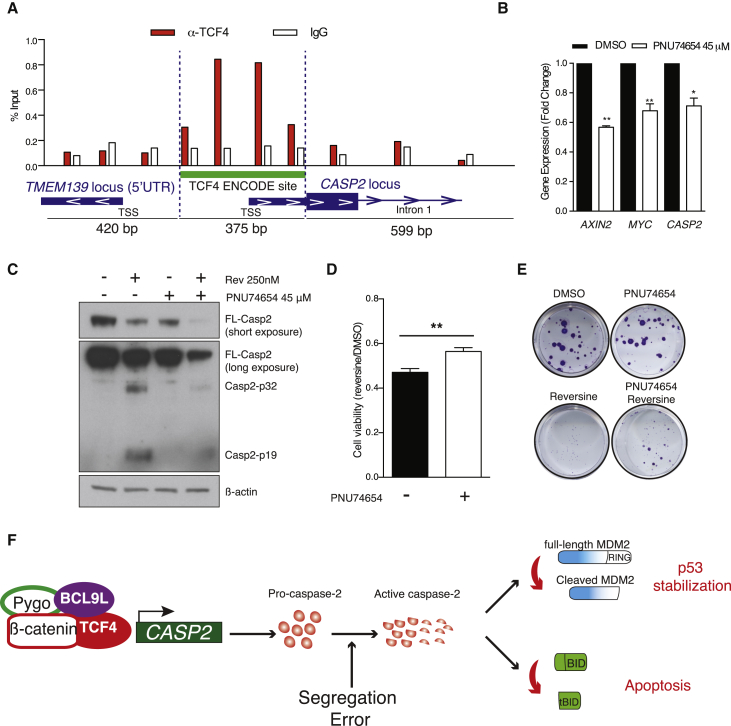
Chromosomal instability (CIN) contributes to cancer evolution, intratumor heterogeneity, and drug resistance. CIN is driven by chromosome segregation errors and a tolerance phenotype that permits the propagation of aneuploid genomes. Through genomic analysis of colorectal cancers and cell lines, we find frequent loss of heterozygosity and mutations in BCL9L in aneuploid tumors. BCL9L deficiency promoted tolerance of chromosome missegregation events, propagation of aneuploidy, and genetic heterogeneity in xenograft models likely through modulation of Wnt signaling. We find that BCL9L dysfunction contributes to aneuploidy tolerance in both TP53-WT and mutant cells by reducing basal caspase-2 levels and preventing cleavage of MDM2 and BID. Efforts to exploit aneuploidy tolerance mechanisms and the BCL9L/caspase-2/BID axis may limit cancer diversity and evolution.

Keywords: BCL9L; BID; aneuploidy tolerance; caspase-2; chromosomal instability; chromosome segregation errors; colorectal cancer evolution; intratumor heterogeneity; mitotic checkpoint; p53.


Figures

None
Graphical abstract
Figure 1
Figure 1
Genomic Analysis of Aneuploid CRC and Cell Lines (A) Non-synonymous somatic mutations and loss of heterozygosity in a discovery cohort of 17 MSS CRC tumors and eight cell lines (in blue). Genes mutated in aneuploid samples are shown separated in two categories (truncating + missense or missense only). Common CRC driver genes are shown at the bottom. Right-hand graph presents the results of the reversine tolerance screen. Each value was normalized to siControl (siCtrl) treated cells, and genes whose knockdown provided a ≥1.4-fold increase in viability were considered for further analysis. (B) Correlation between BCL9L copy number and mRNA level in MSS CRC in the TCGA dataset. Loss (CN = 0 or 1), neutral (CN = 2), and gain (CN ≥ 3). RPKM, reads per kilobase of transcript per million mapped reads; p values were calculated by unpaired Student's t test. (C) wGII in MSS CRC TCGA samples with BCL9L alterations and wild-type BCL9L (p values calculated by unpaired Student's t test). (D) Co-occurrence and mutual exclusivity of BCL9L alterations and TP53 mutations in TCGA MSS CRC (percentage of all MSS samples). (E) wGII in samples with mutually exclusive and co-occurring BCL9L and TP53 somatic alterations (MSS CSC TCGA; p values calculated by unpaired Student’s t test). (F) Allelic pattern of BCL9L alterations in TCGA MSS CRC (percentage of all MSS samples). (G) Mapping of non-synonymous mutations across the BCL9L protein identified in four different cohorts. Error bars denote 95% confidence interval. ns, not significant. ∗∗p < 0.01, ∗∗∗p < 0.001. See also Figure S3 and Tables S2–S4.
Figure 2
Figure 2
BCL9L Knockdown Confers Aneuploidy Tolerance in HCT-116 Cells (A) siRNA knockdown of BCL9L protein (top) and mRNA (bottom) in HCT-116 (representative experiments shown, Qiagen siRNA pool). (B–D) Impact of 250 nM reversine treatment on cell viability (B), cell number (C), and fraction of BrdU-incorporating cells (D) following control or BCL9L siRNA transfection (72 hr, n = 3; p values calculated by paired Student's t test). (E) Colony-forming efficiency of HCT-116 after siRNA transfection and 250 nM reversine treatment. (F) Fold change induction of Caspase-3/7 enzymatic activity following 250 nM reversine treatment in HCT-116 transfected control siRNA or after BCL9L knockdown (72 hr, n = 3, p value calculated by paired Student's t test). (G) Live-cell imaging analysis of post-mitotic daughter cell fate after a normal mitosis or mitosis with endogenous segregation errors. Daughter cells were tracked for at least 48 hr. Arrest was defined as the absence of cell division within 48 hr post mitosis. Death was defined as visible nuclear collapse. (H) Effect of stable lentiviral BCL9L knockdown on colony-forming efficiency of HCT-116 treated with 125 nM reversine for 15 days and recovered for additional 15 days. (I) Modal centromeric deviation (%) in the number of FISH signals (CEP 1, 2, 8, and 15) in reversine-treated and untreated HCT-116 cells with lentiviral stable BCL9L knockdown (n = 3, 400–500 nuclei scored per experiment). Cells were treated as in (H). (J) Karyotypic analysis following stable lentiviral BCL9L knockdown and reversine treatment. Metaphases were stained with a pan-centromeric probe (70–100 cells analyzed, modal number of chromosomes and percentage deviating from the mode shown at the top; p values calculated by two-sided Wilcoxon rank-sum test). Error bars denote SD. ns, not significant. p < 0.05, ∗∗p < 0.01, ∗∗∗p < 0.001. See also Figures S4 and S5.
Figure 3
Figure 3
Heterozygous Truncation of BCL9L Drives Aneuploidy Tolerance in HCT-116 Cells (A) Mapping of the CRISPR protospacer site on the BCL9L protein. Guide RNA targets nucleotides 2,542–2,561 (BCL9L cDNA sequence GenBank: NM_182557). (B) Genotyping results of BCL9L CRISPR clones selected in 125 nM reversine for 15 days (percentage of all isolated clones). (C) Karyotypic analysis of an isolated HCT-116 clone bearing a heterozygous 5-bp deletion C-terminal to the HD3 domain in BCL9L (p.Glu530fs) (70–100 cells analyzed, modal number of chromosomes and percent deviating from the mode shown above the graph; p value calculated by two-sided Wilcoxon rank-sum test). (D) Effect of BCL9L depletion on cell viability of isogenic TP53-WT and null HCT-116 cells (72 hr, n = 3; p value calculated by paired Student's t test). Cell viability was measured by CellTiter-Blue (Promega). (E) Colony-formation assay in CRC TP53-mutant cells (TP53-null HCT-116 and CL-40). Error bars denote SD. p < 0.05, ∗∗p < 0.01, ∗∗∗p < 0.001. See also Figure S5.
Figure 4
Figure 4
BCL9L Depletion Results in Intratumor Heterogeneity in Xenografts (A) Experimental procedure for xenograft experiments. Stable shBCL9L HCT-116 cells were treated as in Figure 2H. Cells (2 × 106) were subcutaneously injected in each mouse flank. (B) Engraftment efficiency of cells treated as described in (A) 60 days following injection. (C) Growth curves of shCtrl and shBCL9L xenografts with and without reversine pre-treatment (mean ± SEM). (D) Genome-wide multi-region SNP DNA copy-number analysis of six xenografts (three shCtrl and three shBCL9L). Red, gain; blue, loss.
Figure 5
Figure 5
Mechanisms of BCL9L-Mediated Aneuploidy Tolerance (A) Effect of BCL9L depletion on p53 protein levels in four near-diploid CRC cell lines following reversine treatment for 72 hr. (B) MDM2 protein expression and cleavage in reversine-treated (72 hr) TP53-WT and TP53-null HCT-116 cells following BCL9L depletion (two exposures shown). (C) Effect of BCL9L depletion on caspase-2 protein expression and cleavage in isogenic HCT-116 cells (72 hr). (D) qPCR analysis of caspase-2 mRNA in BCL9L-depleted TP53-WT and TP53-null HCT-116 cells (n = 3; p value calculated by unpaired Student's t test). (E) BID protein expression and cleavage (tBID) in reversine-treated TP53-null HCT-116 cells following BCL9L or caspase-2 depletion (72 hr). (F) Effect of BCL9L and caspase-2 depletion on PARP cleavage in TP53-null HCT-116 cells (72 hr). (G) Effect of BID silencing on colony-forming efficiency in reversine-treated TP53-null HCT-116 cells. (H) Live-cell imaging analysis of daughter cell fate after normal mitosis and mitosis with endogenous segregation errors in caspase-2-depleted HCT-116 cells. (I) Viability of cells at 72 hr after co-transfecting pcDNA3-caspase-2-FLAG or empty control together with the indicated siRNA in the presence and absence of 250 nM reversine (n = 3; p value calculated by paired Student's t test). Error bars denote SD. ns, not significant. p < 0.05, ∗∗p < 0.01, ∗∗∗p < 0.001. See also Figures S6 and S7.
Figure 6
Figure 6
Mechanism of BCL9L in the Regulation of Caspase-2 Expression (A) Chromatin immunoprecipitation of TCF4 and qPCR analysis of the immunoprecipitated DNA. Primers were designed across the caspase-2 promoter region that contains a TCF4 binding site annotated in ENCODE (bars are located approximately in the center of the resulting amplicon). TSS, transcription start site; IgG, immunoglobulin G. (B) mRNA expression analysis of caspase-2 and the Wnt targets AXIN2 and MYC following treatment with 45 μM PNU74654 (n = 3; p values calculated by unpaired Student's t test). (C) Effect of PNU74654 on caspase-2 protein with and without reversine treatment. (D) Effect of PNU74654 on cell viability following reversine treatment in HCT-116 cells (mean ± SD, n = 3). (E) Colony-forming efficiency of HCT-116 cells treated with reversine in the presence or absence of 45 μM PNU74654. (F) Proposed mechanism of BCL9L in aneuploidy surveillance. Error bars denote SD. p < 0.05, ∗∗p < 0.01. See also Figure S8.

References

    1. Albuquerque C., Breukel C., van del Luijt R., Fidalgo P., Lage P., Slors F.J.M., Nobre-Leitao C., Fodde R., Smits R. The “just-right” signaling model: APC somatic mutations are selected based on a specific level of activation of the β-catenin signaling cascade. Hum. Mol. Genet. 2002;11:1549–1560. - PubMed
    1. Andersen J.L., Johnson C.E., Freel C.D., Parrish A.B., Day J.L., Buchakjian M.R., Nutt L.K., Thompson J.W., Moseley M.A., Kornbluth S. Restraint of apoptosis during mitosis through interdomain phosphorylation of caspase-2. EMBO J. 2009;28:3216–3227. - PMC - PubMed
    1. Andor N., Graham T.A., Jansen M., Xia L.C., Aktipis C.A., Petritsch C., Ji H.P., Maley C.C. Pan-cancer analysis of the extent and consequences of intratumor heterogeneity. Nat. Med. 2015;22:105–113. - PMC - PubMed
    1. Bakhoum S.F., Genovese G., Compton D.A. Deviant kinetochore microtubule dynamics underlie chromosomal instability. Curr. Biol. 2009;19:1937–1942. - PMC - PubMed
    1. Bakhoum S.F., Thompson S.L., Manning A.L., Compton D.A. Genome stability is ensured by temporal control of kinetochore-microtubule dynamics. Nat. Cell Biol. 2009;11:27–35. - PMC - PubMed

Publication types

MeSH terms