Protective role of endogenous plasmalogens against hepatic steatosis and steatohepatitis in mice
- PMID: 28073164
- PMCID: PMC5503808
- DOI: 10.1002/hep.29039
Protective role of endogenous plasmalogens against hepatic steatosis and steatohepatitis in mice
Erratum in
-
Correction.Hepatology. 2019 Jul;70(1):453. doi: 10.1002/hep.30806. Hepatology. 2019. PMID: 31245882 No abstract available.
Abstract
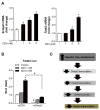
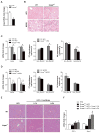
Free cholesterol (FC) accumulation in the liver is an important pathogenic mechanism of nonalcoholic steatohepatitis (NASH). Plasmalogens, key structural components of the cell membrane, act as endogenous antioxidants and are primarily synthesized in the liver. However, the role of hepatic plasmalogens in metabolic liver disease is unclear. In this study, we found that hepatic levels of docosahexaenoic acid (DHA)-containing plasmalogens, expression of glyceronephosphate O-acyltransferase (Gnpat; the rate-limiting enzyme in plasmalogen biosynthesis), and expression of Pparα were lower in mice with NASH caused by accumulation of FC in the liver. Cyclodextrin-induced depletion of FC transactivated Δ-6 desaturase by increasing sterol regulatory element-binding protein 2 expression in cultured hepatocytes. DHA, the major product of Δ-6 desaturase activation, activated GNPAT, thereby explaining the association between high hepatic FC and decreased Gnpat expression. Gnpat small interfering RNA treatment significantly decreased peroxisome proliferator-activated receptor α (Pparα) expression in cultured hepatocytes. In addition to GNPAT, DHA activated PPARα and increased expression of Pparα and its target genes, suggesting that DHA in the DHA-containing plasmalogens contributed to activation of PPARα. Accordingly, administration of the plasmalogen precursor, alkyl glycerol (AG), prevented hepatic steatosis and NASH through a PPARα-dependent increase in fatty acid oxidation. Gnpat+/- mice were more susceptible to hepatic lipid accumulation and less responsive to the preventive effect of fluvastatin on NASH development, suggesting that endogenous plasmalogens prevent hepatic steatosis and NASH.
Conclusion: Increased hepatic FC in animals with NASH decreased plasmalogens, thereby sensitizing animals to hepatocyte injury and NASH. Our findings uncover a novel link between hepatic FC and plasmalogen homeostasis through GNPAT regulation. Further study of AG or other agents that increase hepatic plasmalogen levels may identify novel therapeutic strategies against NASH. (Hepatology 2017;66:416-431).
© 2017 by the American Association for the Study of Liver Diseases.
Conflict of interest statement
J.E.J., E.H.K. and K.-U.L. have applied for a patent on the effect of alkyl glycerol on nonalcoholic steatohepatitis.
Figures


Similar articles
-
Peroxisome proliferator-activated receptor-α agonist, Wy 14,643, improves metabolic indices, steatosis and ballooning in diabetic mice with non-alcoholic steatohepatitis.J Gastroenterol Hepatol. 2012 Feb;27(2):341-50. doi: 10.1111/j.1440-1746.2011.06939.x. J Gastroenterol Hepatol. 2012. PMID: 21929649
-
Loss of miR-141/200c ameliorates hepatic steatosis and inflammation by reprogramming multiple signaling pathways in NASH.JCI Insight. 2017 Nov 2;2(21):e96094. doi: 10.1172/jci.insight.96094. JCI Insight. 2017. PMID: 29093267 Free PMC article.
-
Methionine restriction prevents the progression of hepatic steatosis in leptin-deficient obese mice.Metabolism. 2013 Nov;62(11):1651-61. doi: 10.1016/j.metabol.2013.06.012. Epub 2013 Aug 5. Metabolism. 2013. PMID: 23928105
-
Free radical biology for medicine: learning from nonalcoholic fatty liver disease.Free Radic Biol Med. 2013 Dec;65:952-968. doi: 10.1016/j.freeradbiomed.2013.08.174. Epub 2013 Aug 29. Free Radic Biol Med. 2013. PMID: 23994574 Review.
-
Role of Cholesterol-Associated Steatohepatitis in the Development of NASH.Hepatol Commun. 2022 Jan;6(1):12-35. doi: 10.1002/hep4.1801. Epub 2021 Aug 24. Hepatol Commun. 2022. PMID: 34558856 Free PMC article. Review.
Cited by
-
Dysregulated hepcidin response to dietary iron in male mice with reduced Gnpat expression.Biosci Rep. 2020 Aug 28;40(8):BSR20201508. doi: 10.1042/BSR20201508. Biosci Rep. 2020. PMID: 32766721 Free PMC article.
-
Anti-Inflammatory Nutrients and Obesity-Associated Metabolic-Inflammation: State of the Art and Future Direction.Nutrients. 2022 Mar 8;14(6):1137. doi: 10.3390/nu14061137. Nutrients. 2022. PMID: 35334794 Free PMC article. Review.
-
Lipidomics in non-alcoholic fatty liver disease.World J Hepatol. 2020 Aug 27;12(8):436-450. doi: 10.4254/wjh.v12.i8.436. World J Hepatol. 2020. PMID: 32952872 Free PMC article. Review.
-
Advances in paediatric nonalcoholic fatty liver disease: Role of lipidomics.World J Gastroenterol. 2021 Jul 7;27(25):3815-3824. doi: 10.3748/wjg.v27.i25.3815. World J Gastroenterol. 2021. PMID: 34321846 Free PMC article. Review.
-
Obese mother offspring have hepatic lipidic modulation that contributes to sex-dependent metabolic adaptation later in life.Commun Biol. 2021 Jan 4;4(1):14. doi: 10.1038/s42003-020-01513-z. Commun Biol. 2021. PMID: 33398027 Free PMC article.
References
-
- Braverman NE, Moser AB. Functions of plasmalogen lipids in health and disease. Biochim Biophys Acta. 2012;1822:1442–1452. - PubMed
-
- Wallner S, Schmitz G. Plasmalogens the neglected regulatory and scavenging lipid species. Chem Phys Lipids. 2011;164:573–589. - PubMed
-
- Heymans HS, Schutgens RB, Tan R, van den Bosch H, Borst P. Severe plasmalogen deficiency in tissues of infants without peroxisomes (Zellweger syndrome) Nature. 1983;306:69–70. - PubMed
-
- Malheiro AR, da Silva TF, Brites P. Plasmalogens and fatty alcohols in rhizomelic chondrodysplasia punctata and Sjogren-Larsson syndrome. J Inherit Metab Dis. 2015;38:111–121. - PubMed
-
- Steinberg SJ, Dodt G, Raymond GV, Braverman NE, Moser AB, Moser HW. Peroxisome biogenesis disorders. Biochim Biophys Acta. 2006;1763:1733–1748. - PubMed

