

Whole Transcriptome Analysis of Pre-invasive and Invasive Early Squamous Lung Carcinoma in Archival Laser Microdissected Samples
- PMID: 28073359
- PMCID: PMC5223343
- DOI: 10.1186/s12931-016-0496-3
Whole Transcriptome Analysis of Pre-invasive and Invasive Early Squamous Lung Carcinoma in Archival Laser Microdissected Samples
Abstract
Background: Preinvasive squamous cell cancer (PSCC) are local transformations of bronchial epithelia that are frequently observed in current or former smokers. Their different grades and sizes suggest a continuum of dysplastic change with increasing severity, which may culminate in invasive squamous cell carcinoma (ISCC). As a consequence of the difficulty in isolating cancerous cells from biopsies, the molecular pathology that underlies their histological variability remains largely unknown.
Method: To address this issue, we have employed microdissection to isolate normal bronchial epithelia and cancerous cells from low- and high-grade PSCC and ISCC, from paraffin embedded (FFPE) biopsies and determined gene expression using Affymetric Human Exon 1.0 ST arrays. Tests for differential gene expression were performed using the Bioconductor package limma followed by functional analyses of differentially expressed genes in IPA.
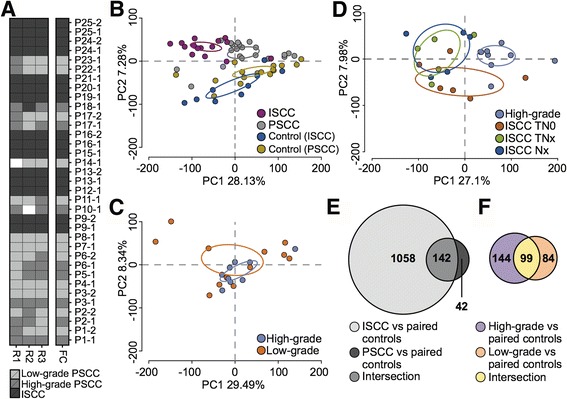
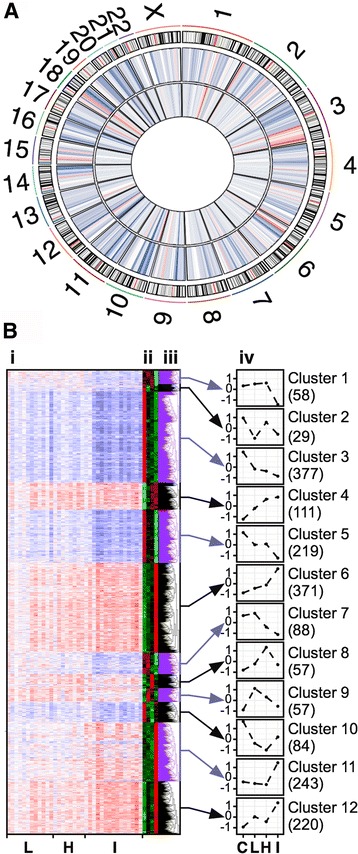
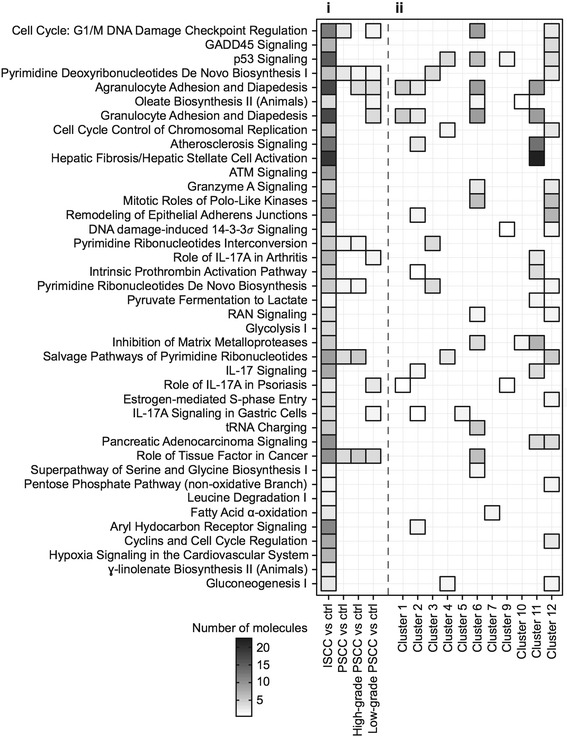
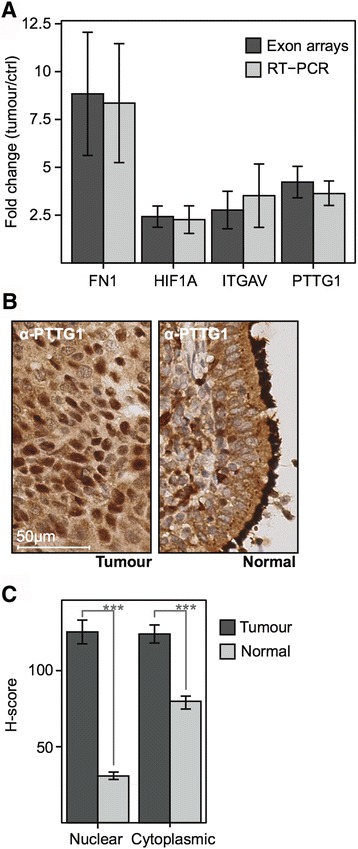
Results: Examination of differential gene expression showed small differences between low- and high-grade PSCC but substantial changes between PSCC and ISCC samples (184 vs 1200 p-value <0.05, fc ±1.75). However, the majority of the differentially expressed PSCC genes (142 genes: 77%) were shared with those in ISCC samples. Pathway analysis showed that these shared genes are associated with DNA damage response, DNA/RNA metabolism and inflammation as major biological themes. Cluster analysis identified 12 distinct patterns of gene expression including progressive up or down-regulation across PSCC and ISCC. Pathway analysis of incrementally up-regulated genes revealed again significant enrichment of terms related to DNA damage response, DNA/RNA metabolism, inflammation, survival and proliferation. Altered expression of selected genes was confirmed using RT-PCR, as well as immunohistochemistry in an independent set of 45 ISCCs.
Conclusions: Gene expression profiles in PSCC and ISCC differ greatly in terms of numbers of genes with altered transcriptional activity. However, altered gene expression in PSCC affects canonical pathways and cellular and biological processes, such as inflammation and DNA damage response, which are highly consistent with hallmarks of cancer.
Keywords: Exon arrays; Gene expression profiling; Invasive squamous cell cancer; Microdissection; Preinvasive squamous cell cancer.
Figures
Similar articles
-
Smoking and cancer-related gene expression in bronchial epithelium and non-small-cell lung cancers.J Pathol. 2006 Oct;210(2):192-204. doi: 10.1002/path.2039. J Pathol. 2006. PMID: 16915569
-
Tumor-microenvironment interactions studied by zonal transcriptional profiling of squamous cell lung carcinoma.Genes Chromosomes Cancer. 2013 Mar;52(3):250-64. doi: 10.1002/gcc.22025. Epub 2012 Oct 17. Genes Chromosomes Cancer. 2013. PMID: 23074073
-
Illumina whole-genome complementary DNA-mediated annealing, selection, extension and ligation platform: assessing its performance in formalin-fixed, paraffin-embedded samples and identifying invasion pattern-related genes in oral squamous cell carcinoma.Hum Pathol. 2011 Dec;42(12):1911-22. doi: 10.1016/j.humpath.2011.02.011. Epub 2011 Jun 17. Hum Pathol. 2011. PMID: 21683979
-
Treating advanced penile cancer: where do we stand in 2019?Curr Opin Support Palliat Care. 2019 Sep;13(3):249-254. doi: 10.1097/SPC.0000000000000431. Curr Opin Support Palliat Care. 2019. PMID: 31082941 Review.
-
Understanding genomics and the immune environment of penile cancer to improve therapy.Nat Rev Urol. 2020 Oct;17(10):555-570. doi: 10.1038/s41585-020-0359-z. Epub 2020 Aug 18. Nat Rev Urol. 2020. PMID: 32812000 Review.
Cited by
-
Identifying General Tumor and Specific Lung Cancer Biomarkers by Transcriptomic Analysis.Biology (Basel). 2022 Jul 20;11(7):1082. doi: 10.3390/biology11071082. Biology (Basel). 2022. PMID: 36101460 Free PMC article.
-
Joint Transcriptomic Analysis of Lung Cancer and Other Lung Diseases.Front Genet. 2019 Dec 6;10:1260. doi: 10.3389/fgene.2019.01260. eCollection 2019. Front Genet. 2019. PMID: 31867044 Free PMC article.
-
Stress Reactivity, Susceptibility to Hypertension, and Differential Expression of Genes in Hypertensive Compared to Normotensive Patients.Int J Mol Sci. 2022 Mar 4;23(5):2835. doi: 10.3390/ijms23052835. Int J Mol Sci. 2022. PMID: 35269977 Free PMC article.
-
Altered Cell-Cycle Control, Inflammation, and Adhesion in High-Risk Persistent Bronchial Dysplasia.Cancer Res. 2018 Sep 1;78(17):4971-4983. doi: 10.1158/0008-5472.CAN-17-3822. Epub 2018 Jul 11. Cancer Res. 2018. PMID: 29997230 Free PMC article.
References
-
- William D. Travis MD, Cancer TIAfRo, Pathology IAo. Pathology & Genetics: Tumours of the Lung, Pleura, Thymus, and Heart: IARC Press, World Health Organisation; 2004. ISBN 9789283224181.
Publication types
MeSH terms
Substances
Grants and funding
LinkOut - more resources
Full Text Sources
Other Literature Sources
Medical
Molecular Biology Databases
Research Materials
