

Advanced Knee Structure Analysis (AKSA): a comparison of bone mineral density and trabecular texture measurements using computed tomography and high-resolution peripheral quantitative computed tomography of human knee cadavers
- PMID: 28073368
- PMCID: PMC5223490
- DOI: 10.1186/s13075-016-1210-z
Advanced Knee Structure Analysis (AKSA): a comparison of bone mineral density and trabecular texture measurements using computed tomography and high-resolution peripheral quantitative computed tomography of human knee cadavers
Abstract
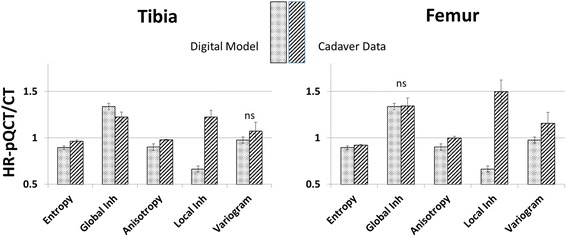
Background: A change of loading conditions in the knee causes changes in the subchondral bone and may be a cause of osteoarthritis (OA). However, quantification of trabecular architecture in vivo is difficult due to the limiting spatial resolution of the imaging equipment; one approach is the use of texture parameters. In previous studies, we have used digital models to simulate changes of subchondral bone architecture under OA progression. One major result was that, using computed tomography (CT) images, subchondral bone mineral density (BMD) in combination with anisotropy and global homogeneity could characterize this progression. The primary goal of this study was a comparison of BMD, entropy, anisotropy, variogram slope, and local and global inhomogeneity measurements between high-resolution peripheral quantitative CT (HR-pQCT) and CT using human cadaveric knees. The secondary goal was the verification of the spatial resolution dependence of texture parameters observed in the earlier simulations, two important prerequisites for the interpretation of in vivo measurements in OA patients.
Method: The applicability of texture analysis to characterize bone architecture in clinical CT examinations was investigated and compared to results obtained from HR-pQCT. Fifty-seven human knee cadavers (OA status unknown) were examined with both imaging modalities. Three-dimensional (3D) segmentation and registration processes, together with automatic positioning of 3D analysis volumes of interest (VOIs), ensured the measurement of BMD and texture parameters at the same anatomical locations in CT and HR-pQCT datasets.
Results: According to the calculation of dice ratios (>0.978), the accuracy of VOI locations between methods was excellent. Entropy, anisotropy, and global inhomogeneity showed significant and high linear correlation between both methods (0.68 < R 2 < 1.00). The resolution dependence of these parameters simulated earlier was confirmed by the in vitro measurements.
Conclusion: The high correlation of HR-pQCT- and CT-based measurements of entropy, global inhomogeneity, and anisotropy suggests interchangeability between devices regarding the quantification of texture. The agreement of the experimentally determined resolution dependence of global inhomogeneity and anisotropy with earlier simulations is an important milestone towards their use to quantify subchondral bone structure. However, an in vivo study is still required to establish their clinical relevance.
Keywords: Computed tomography; High-resolution peripheral quantitative computed tomography; Knee OA; Subchondral bone; Texture.
Figures


Similar articles
-
Characterization of knee osteoarthritis-related changes in trabecular bone using texture parameters at various levels of spatial resolution-a simulation study.Bonekey Rep. 2014 Dec 3;3:615. doi: 10.1038/bonekey.2014.110. eCollection 2014. Bonekey Rep. 2014. PMID: 25512855 Free PMC article.
-
An integrated segmentation and analysis approach for QCT of the knee to determine subchondral bone mineral density and texture.IEEE Trans Biomed Eng. 2012 Sep;59(9):2449-58. doi: 10.1109/TBME.2012.2202660. Epub 2012 Jun 5. IEEE Trans Biomed Eng. 2012. PMID: 22692866
-
Computed tomography topographic mapping of subchondral density (CT-TOMASD) in osteoarthritic and normal knees: methodological development and preliminary findings.Osteoarthritis Cartilage. 2009 Oct;17(10):1319-26. doi: 10.1016/j.joca.2009.04.013. Epub 2009 May 4. Osteoarthritis Cartilage. 2009. PMID: 19427927
-
CT imaging for the investigation of subchondral bone in knee osteoarthritis.Osteoporos Int. 2012 Dec;23 Suppl 8:S861-5. doi: 10.1007/s00198-012-2169-5. Epub 2012 Nov 22. Osteoporos Int. 2012. PMID: 23179574 Review.
-
Three-Dimensional Analysis of the Trapezium Subchondral Bone and its Association with Trapeziometacarpal Joint Osteoarthritis.Calcif Tissue Int. 2023 Mar;112(3):320-327. doi: 10.1007/s00223-022-01040-5. Epub 2022 Nov 10. Calcif Tissue Int. 2023. PMID: 36357542 Review.
Cited by
-
Quantifying the Human Subchondral Trabecular Bone Microstructure in Osteoarthritis with Clinical CT.Adv Sci (Weinh). 2022 Aug;9(23):e2201692. doi: 10.1002/advs.202201692. Epub 2022 Jun 7. Adv Sci (Weinh). 2022. PMID: 35670136 Free PMC article.
-
A degenerative medial meniscus retains some protective effect against osteoarthritis-induced subchondral bone changes.Bone Rep. 2020 May 16;12:100271. doi: 10.1016/j.bonr.2020.100271. eCollection 2020 Jun. Bone Rep. 2020. PMID: 32478143 Free PMC article.
-
High-Titer Rheumatoid Factor is Associated with Worse Clinical Outcomes and Higher Needs for Advanced Therapies in Rheumatoid Arthritis Under Real-Life Conditions.Rheumatol Ther. 2025 Feb;12(1):123-136. doi: 10.1007/s40744-024-00730-w. Epub 2024 Dec 19. Rheumatol Ther. 2025. PMID: 39699750 Free PMC article.
-
Salivary Extracellular Vesicles Separation: Analysis of Ultracentrifugation-Based Protocols.Oral Dis. 2025 Mar;31(3):879-889. doi: 10.1111/odi.15171. Epub 2024 Oct 27. Oral Dis. 2025. PMID: 39462790 Free PMC article.
-
Economic burden of musculoskeletal disorders in Tanzania: results from a community-based survey.BMJ Open. 2025 Jan 15;15(1):e087425. doi: 10.1136/bmjopen-2024-087425. BMJ Open. 2025. PMID: 39819935 Free PMC article.
References
-
- Djuric M, Zagorac S, Milovanovic P, Djonic D, Nikolic S, Hahn M, et al. Enhanced trabecular micro-architecture of the femoral neck in hip osteoarthritis vs. healthy controls: a micro-computer tomography study in postmenopausal women. Int Orthop. 2013;37:21–6. doi: 10.1007/s00264-012-1713-4. - DOI - PMC - PubMed
-
- Li ZC, Dai LY, Jiang LS, Qiu S. Difference in subchondral cancellous bone between postmenopausal women with hip osteoarthritis and osteoporotic fracture: implication for fatigue microdamage, bone microarchitecture, and biomechanical properties. Arthritis Rheum. 2012;64:3955–62. doi: 10.1002/art.34670. - DOI - PubMed
Publication types
MeSH terms
LinkOut - more resources
Full Text Sources
Other Literature Sources
Medical
