. 2017 Jan 10;7(1):1.
doi: 10.1186/s13395-016-0118-2.

A novel method for the quantification of fatty infiltration in skeletal muscle

Affiliations

A novel method for the quantification of fatty infiltration in skeletal muscle

Nicole K Biltz et al. Skelet Muscle. .

Abstract

Background: Fatty infiltration of the skeletal muscle is a common but poorly understood feature of many myopathies. It is best described in human muscle, where non-invasive imaging techniques and representative histology have been optimized to view and quantify infiltrating fat. However, human studies are limited in their ability to identify cellular and molecular mechanisms regulating fatty infiltration, a likely prerequisite to developing targeted interventions. As mechanistic investigations move to small animals, studies may benefit from new or adapted imaging tools optimized for high resolution and whole muscle quantification.

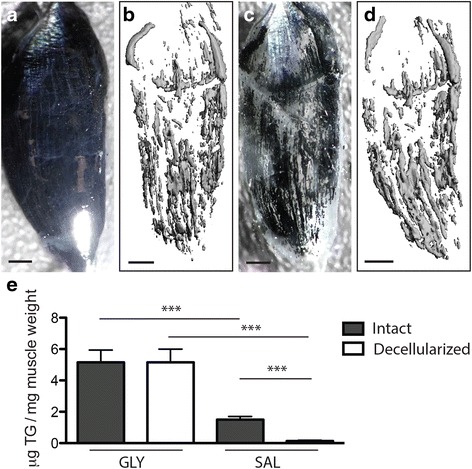
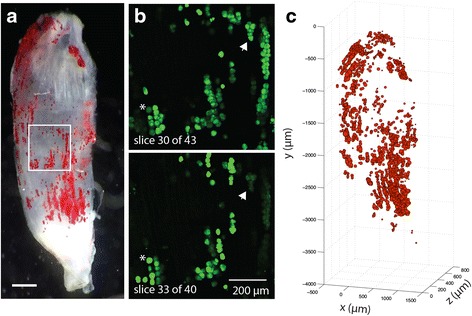
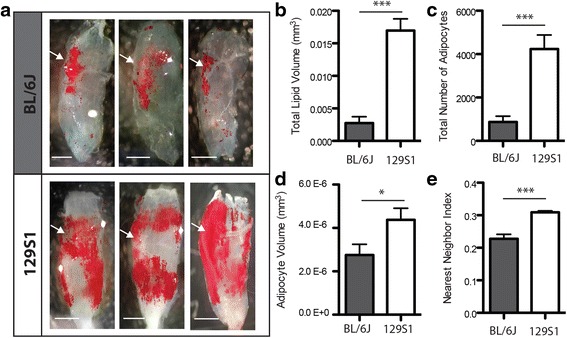
Results: Here, we describe a novel method to evaluate fatty infiltration, developed for use with mouse muscle. In this methodology, muscle cellular membranes and proteins are removed via decellularization, but fatty infiltrate lipid is spared, trapped in its native distribution in a transparent extracellular matrix construct. This lipid can then be stained with visible or fluorescent dyes and imaged. We present three methods to stain and evaluate lipid in decellularized muscles which can be used individually or combined: (1) qualitative visualization of the amount and 3D spatial distribution of fatty infiltration using visible lipid soluble dye Oil Red O (ORO), (2) quantitative analysis of individual lipid droplet metrics (e.g., volume) via confocal imaging of fluorescent lipid soluble dye boron-dipyrromethene (BODIPY), and (3) quantitative analysis of total lipid content by optical density reading of extracted stained lipid. This methodology was validated by comparing glycerol-induced fatty infiltration between two commonly used mouse strains: 129S1/SvlmJ (129S1) and C57BL/6J (BL/6J). All three methods were able to detect a significant increase in fatty infiltrate volume in the 129S1 muscle compared with that in BL/6J, and methods 1 and 2 additionally described a difference in the distribution of fatty infiltrate, indicating susceptibility to glycerol-induced fatty infiltration is strain-specific.

Conclusions: With more mechanistic studies of fatty infiltration moving to small animal models, having an alternative to expensive non-invasive imaging techniques and selective representative histology will be beneficial. In this work, we present a method that can quantify both individual adipocyte lipids and whole muscle total fatty infiltrate lipid.

Keywords: Fatty infiltration; IMAT; Intramuscular fat; Muscle lipid.


Figures

Fig. 1
Fig. 1
Illustration of qualitative inspection of fatty infiltration by decellularization and oil red O (ORO) staining. a A representative isolated 5th toe EDL muscle. b The same muscle following decellularization. Decellularization removes myocellular proteins but spares large lipid droplets visible as spherical structure with increased reflectance in a semi-transparent construct. c The same muscle following staining with the lipid soluble dye ORO where lipid droplets are stained bright red. Some superficial lipid is visible in the intact muscle and can be tracked through the decellularization and staining process (inset, using the proximal vessel as an anatomical landmark). Scale bars are 500 μm
Fig. 2
Fig. 2
Fatty infiltrate lipid, but not intramyocellular lipid, is retained in decellularized muscles. a An isolated 5th toe EDL muscle stained with osmium tetroxide. The opaque black appearance of the muscle is due to osmium binding with intramyocellular lipid and phospholipids in fiber membranes in addition to fatty infiltrate lipid. b 3D rendering of the osmium signal acquired via μCT. Thresholding was used to isolate the high signal intensity originating in fatty infiltrate from the low signal originating from myocellular lipids. c Decellularization of the same muscle following imaging. Retained lipid, stained black, has the same qualitative distribution pattern as the 3D μCT rendering. d Re-imaging of the decellularized muscle yields a similar 3D μCT rendering to that obtained from the intact muscle. Note that the shift in orientation in the lower quadrant is the result of bending during re-embedding in agarose. e Triglyeride content in tibialis anterior (TA) muscles quantified by lipid extraction and normalized to pre-decellularized muscle weight. Both intact and decellularized muscles treated with GLY have significantly higher triglyceride content than intact and decellularized muscles treated with SAL, respectively. Scale bars are 500 μm. In the SAL treatment group, nearly all lipids present in the intact group is eliminated in the decellularized group. ***p < 0.0005
Fig. 3
Fig. 3
Illustration of quantitative analysis of lipid droplet metrics by fluorescent confocal microscopy. a ORO (red)-stained decellularized 5th toe EDL muscle used for qualitative reference. Scale bar is 500 μm. b Two representative image slices from a confocal stack acquired of the image area boxed in panel a. BODIPY-positive (green) circular areas can be clearly differentiated. Some of the same areas can be seen in both slices (asterisks and arrows) but have maximal signal strength only in one (the slice where the ROI was registered). c The 3D reconstruction performed on all registered ROIs. Qualitative comparison of this map and the ORO-stained image in panel a shows good representation through the muscle volume
Fig. 4
Fig. 4
Estimated adipocyte volumes are similar between intact and decelluarized 5th toe EDL muscles. a Representative sequential histology demonstrating lipid withdrawal (arrows) and fractionation (asterisks) artifacts incurred by sectioning and ORO staining. Perilipin immunofluorescent signal (red, center) marks where lipid membranes remain fixed and eosin staining (pink, right) shows fiber material where ORO staining marked lipid. b Histogram of adipocyte volumes estimated from sequential perilipin and H&E staining of serial sections of intact muscle (combined data from four sampled muscle volumes). c Histogram of adipocyte volumes estimated from fluorescent confocal imaging of decellularized muscles (combined data from four muscles)
Fig. 5
Fig. 5
Fatty infiltration resulting from GLY injection is higher in the 129S1/Sv1mJ (129S1) mouse strain than in the C57BL/6J (BL/6J) mouse strain. a Images of ORO staining in decellularized muscles following GLY injection for three representative BL/6J muscles (upper panel) and three representative 129S1 muscles (lower panel). The location of the proximal vessel structure is indicated by the arrows. Global differences in both quantity and distribution of fatty infiltration are apparent between strains. Quantification of fatty infiltration metrics finds that b total lipid volume, c total number of adipocytes, d average adipocyte volume, e and the nearest neighbor index (a measure of spatial clustering) are significantly increased in the 129S1 muscle compared in the BL/6J. ***p < 0.0005
Fig. 6
Fig. 6
Quantification of lipid volume by optical density (OD) measurement of ORO content in extracted lipid. a Regression of ORO extraction vs. lipid volume measurements via fluorescent confocal microscopic analysis (data from Fig. 5). ORO OD readings are significantly correlated (p < 0.0001) with lipid volume measurements made prior to ORO staining. Inset shows a magnified view of the low lipid volume data points. b ORO OD readings are sensitive enough to detect a significant difference between strains. ***p < 0.0005

References

    1. Delmonico MJ, Harris TB, Visser M, Park SW, Conroy MB, Velasquez-Mieyer P, et al. Longitudinal study of muscle strength, quality, and adipose tissue infiltration. Am J Clin Nutr Am Soc Nutr. 2009;90:1579–1585. doi: 10.3945/ajcn.2009.28047. - DOI - PMC - PubMed
    1. Goodpaster BH, Thaete FL, Kelley DE. Thigh adipose tissue distribution is associated with insulin resistance in obesity and in type 2 diabetes mellitus. Am J Clin Nutr. 2000;71:885–892. - PubMed
    1. Cahill KV, Buerger GF, Johnson BL. Ptosis associated with fatty infiltration of Müller’s muscle and levator muscle. Ophthal Plast Reconstr Surg. 1986;2:213–217. doi: 10.1097/00002341-198601070-00008. - DOI - PubMed
    1. Cheema B, Abas H, Smith B, O'Sullivan AJ, Chan M, Patwardhan A, et al. Investigation of skeletal muscle quantity and quality in end-stage renal disease. Nephrology (Carlton) Blackwell publ asia. 2010;15:454–463. - PubMed
    1. Elliott J, Jull G, Noteboom JT, Darnell R, Galloway G, Gibbon WW. Fatty infiltration in the cervical extensor muscles in persistent whiplash-associated disorders: a magnetic resonance imaging analysis. Spine. 2006;31:E847–E855. doi: 10.1097/01.brs.0000240841.07050.34. - DOI - PubMed

Publication types

Substances

LinkOut - more resources