. 2017 Feb;5(2):106-117.
doi: 10.1158/2326-6066.CIR-16-0391. Epub 2017 Jan 10.

Temporally Distinct PD-L1 Expression by Tumor and Host Cells Contributes to Immune Escape

Affiliations

Temporally Distinct PD-L1 Expression by Tumor and Host Cells Contributes to Immune Escape

Takuro Noguchi et al. Cancer Immunol Res. 2017 Feb.

Abstract

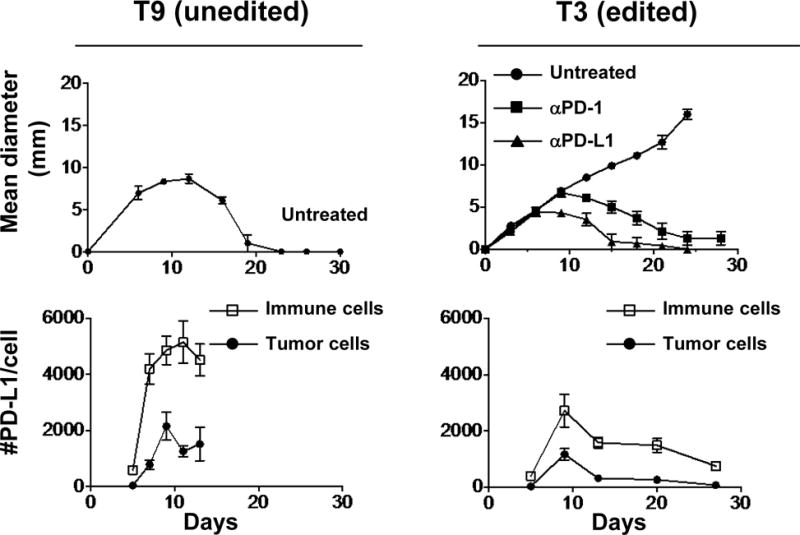
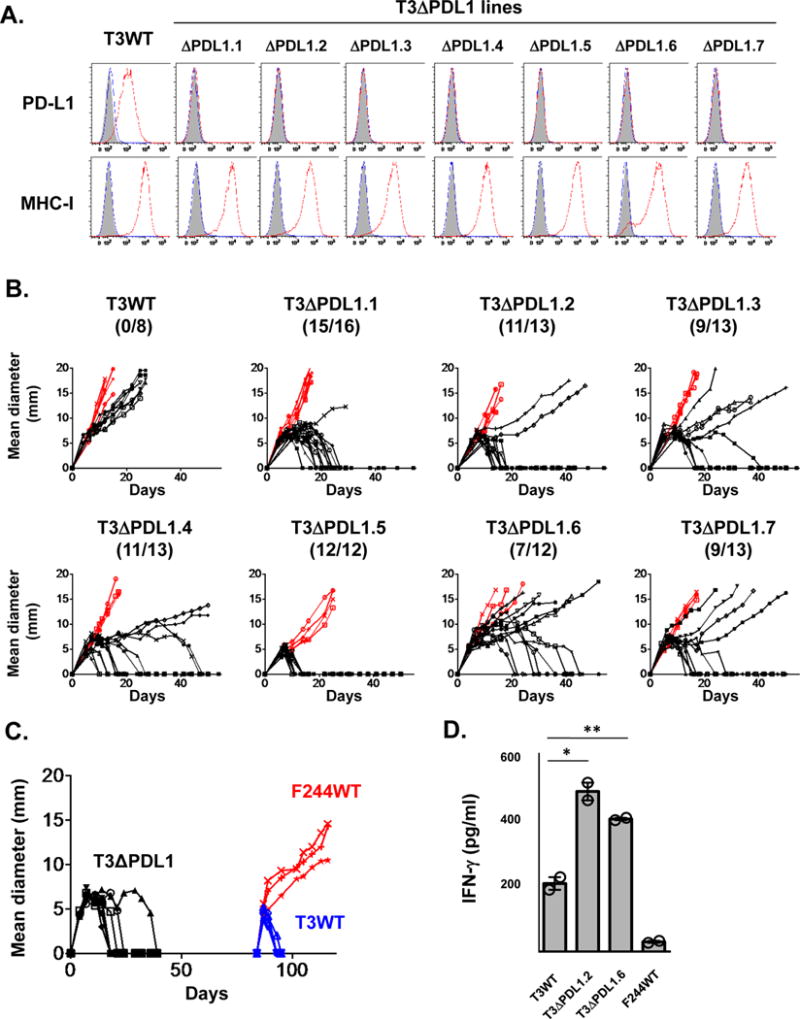
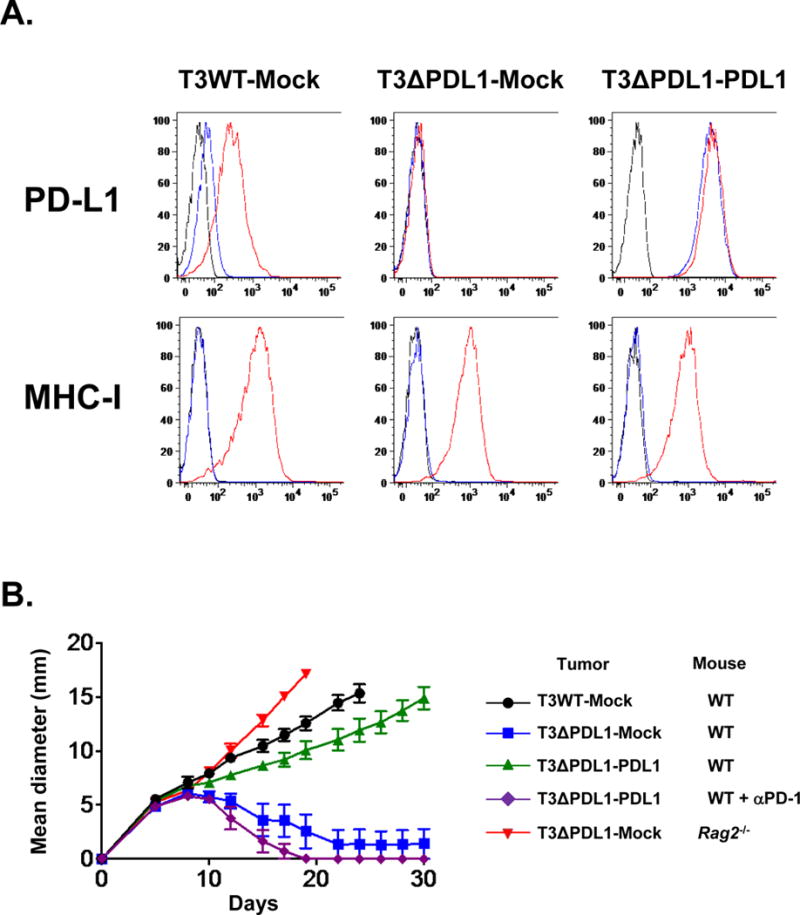
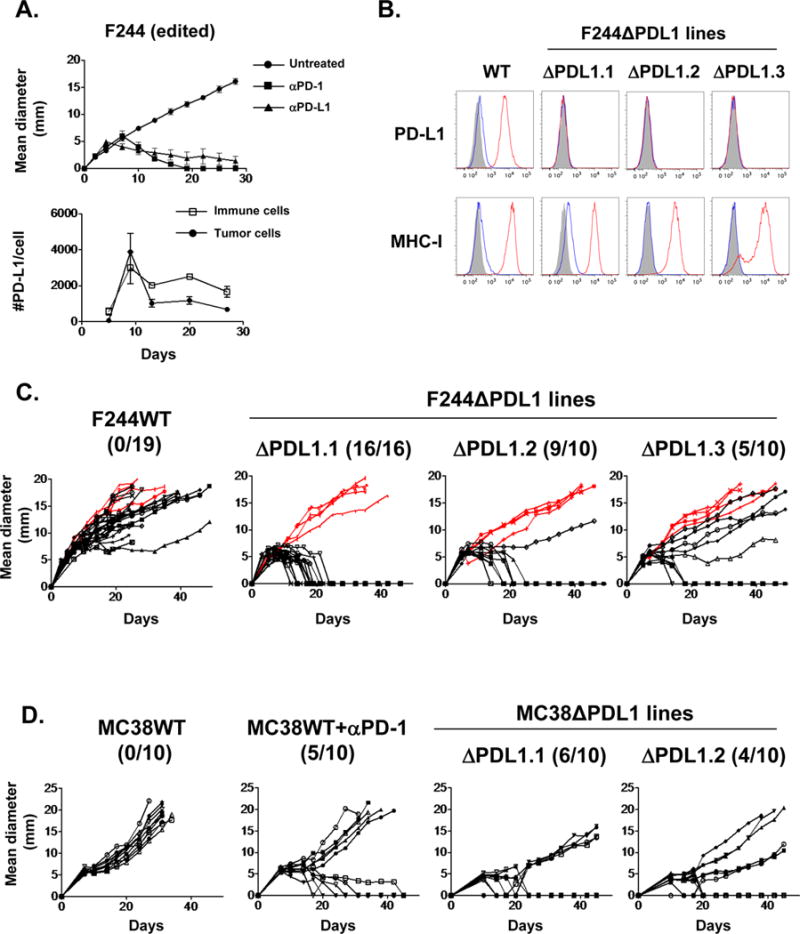
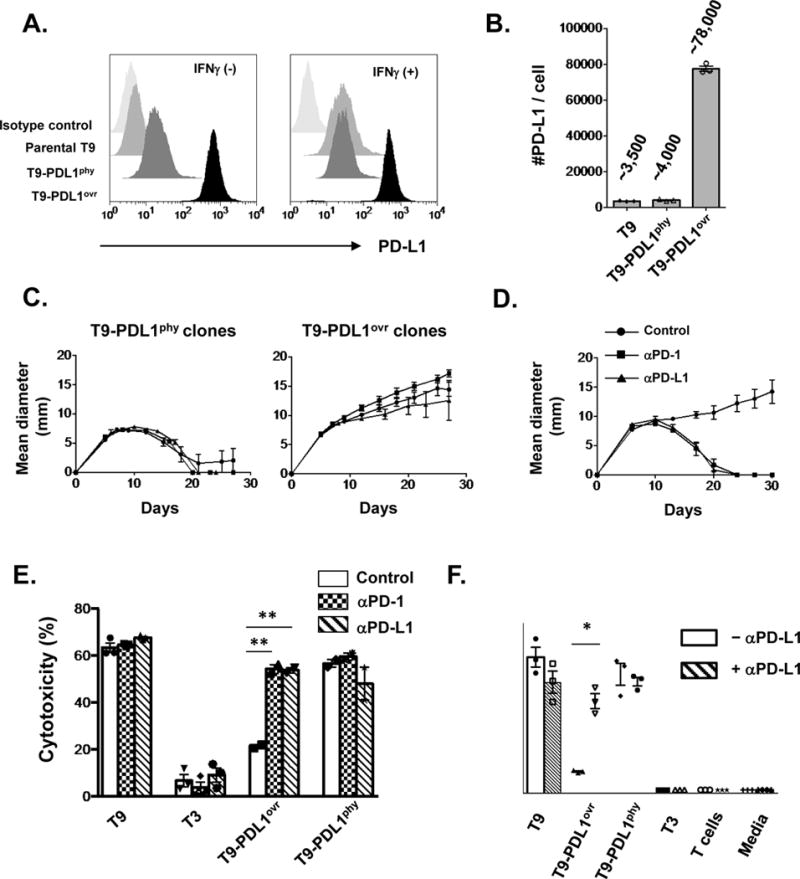
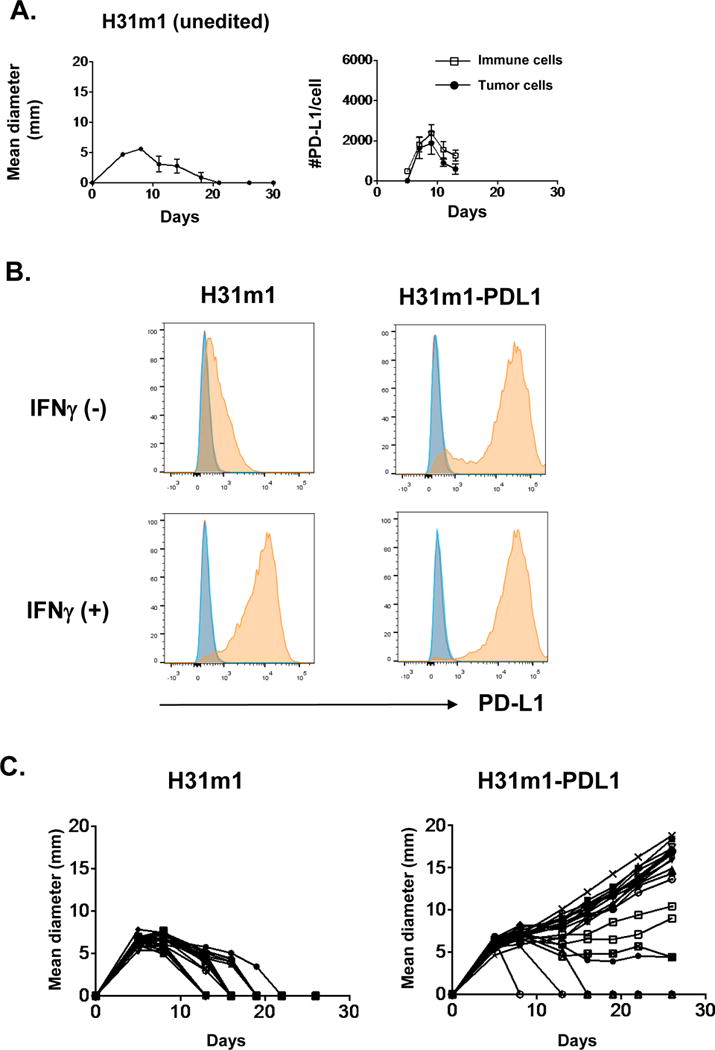
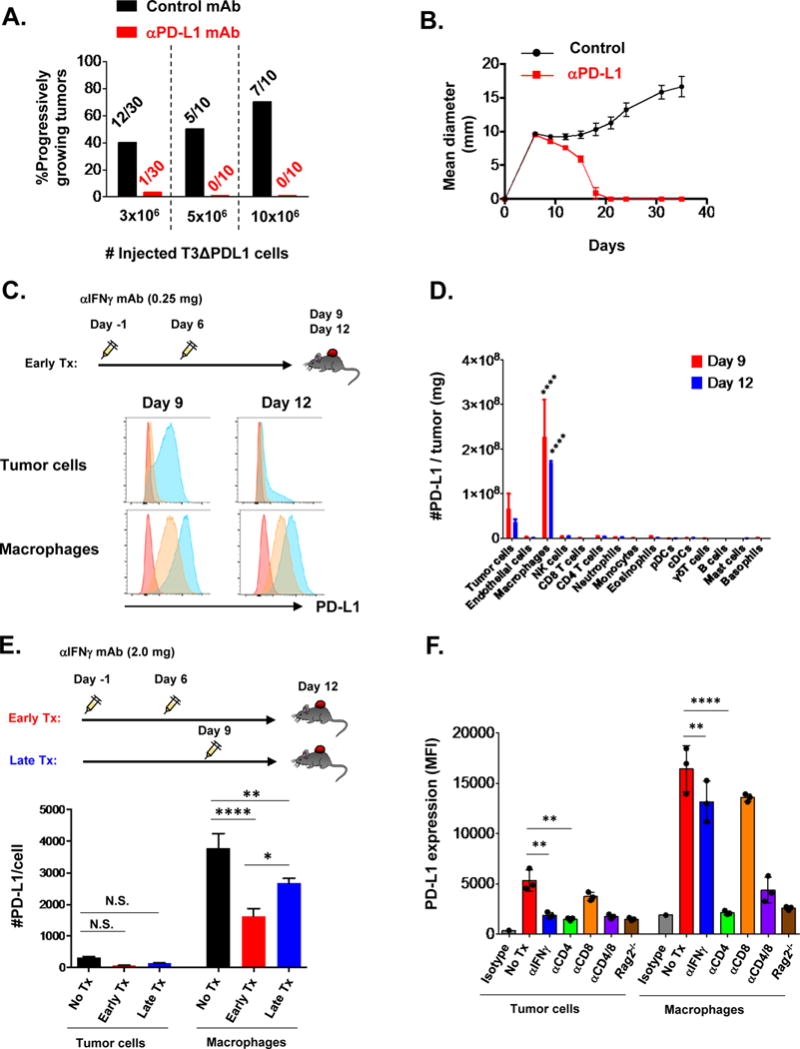
Antibody blockade of programmed death-1 (PD-1) or its ligand, PD-L1, has led to unprecedented therapeutic responses in certain tumor-bearing individuals, but PD-L1 expression's prognostic value in stratifying cancer patients for such treatment remains unclear. Reports conflict on the significance of correlations between PD-L1 on tumor cells and positive clinical outcomes to PD-1/PD-L1 blockade. We investigated this issue using genomically related, clonal subsets from the same methylcholanthrene-induced sarcoma: a highly immunogenic subset that is spontaneously eliminated in vivo by adaptive immunity and a less immunogenic subset that forms tumors in immunocompetent mice, but is sensitive to PD-1/PD-L1 blockade therapy. Using CRISPR/Cas9-induced loss-of-function approaches and overexpression gain-of-function techniques, we confirmed that PD-L1 on tumor cells is key to promoting tumor escape. In addition, the capacity of PD-L1 to suppress antitumor responses was inversely proportional to tumor cell antigenicity. PD-L1 expression on host cells, particularly tumor-associated macrophages (TAM), was also important for tumor immune escape. We demonstrated that induction of PD-L1 on tumor cells was IFNγ-dependent and transient, but PD-L1 induction on TAMs was of greater magnitude, only partially IFNγ dependent, and was stable over time. Thus, PD-L1 expression on either tumor cells or host immune cells could lead to tumor escape from immune control, indicating that total PD-L1 expression in the immediate tumor microenvironment may represent a more accurate biomarker for predicting response to PD-1/PD-L1 blockade therapy, compared with monitoring PD-L1 expression on tumor cells alone. Cancer Immunol Res; 5(2); 106-17. ©2017 AACR.


Conflict of interest statement

Conflict of Interest: R.D. Schreiber has ownership interest in, and is a consultant/advisory board member for, Igenica, Jounce, and Neon. M. J. Selby, R.F. Graziano and A.J. Korman are employees of Bristol-Myers Squibb. The other authors report no conflicts of interest.

Figures

Figure 1
Figure 1. Highly related T9 and T3 sarcoma cells show distinct tumor growth patterns but similar PD-L1 expression kinetics in vivo
Top: In vivo tumor growth of unedited T9 and edited T3 sarcoma clones in naïve syngeneic 129S6 strain WT mice. Groups of 5 mice bearing T9 sarcoma cells were left untreated. Groups of 5 mice bearing T3 sarcoma cells were left untreated or treated with anti-PD-1 (RMP1-14) or anti-PD-L1 mAb (10F.9G2). Data are shown by mean ± s.e.m from at least two independent experiments. Bottom: Numbers of PD-L1 molecules on tumor (CD45) and immune cells (CD45+) in vivo. Data are shown by mean ± s.e.m from two independent experiments (n = 4).
Figure 2
Figure 2. Ablation of PD-L1 in edited T3 sarcoma cells leads to augmented growth inhibition in WT mice
A) In vitro PD-L1 and MHC class I (H2-Kb) expression on cells treated with IFNγ were analyzed by flow cytometry. Black: isotype control, blue: untreated, red: IFNγ treated. Data are shown from at least three independent experiments. B) In vivo tumor growth of T3WT and T3ΔPDL1 lines in syngeneic WT (black) or Rag2−/− mice (red). T3WT are parental T3 sarcoma cells. T3ΔPDL1.1-T3ΔPDL1.7 are T3 lines treated with CRISPR-Cas9 + sgRNA that lack PD-L1 expression (T3ΔPDL1). Each panel represents data from 2–3 independent experiments. Numbers in parentheses show tumor-free WT mice / total WT mice on day 50 post-transplantation. C) Mice rejecting T3ΔPDL1 cells mount a memory response to parental T3 cells. Seven naïve syngeneic WT mice were challenged with T3ΔPDL1.1 cells on day 0. After in vivo rejection, mice were rested for 45 days and then challenged with T3 (n = 4) or F244 (n = 3) sarcoma cells. Data are shown from at least two independent experiments. D) In vitro IFNγ secretion from mutant Lama4-specific T cells (CTL74.17) against T3WT, T3ΔPDL1.2, T3ΔPDL1.6 cells. Data are shown by mean ± s.e.m of technical duplicates from two independent experiments. Samples were compared using an unpaired, two-tailed Student’s t test. **P < 0.01, *P < 0.05.
Figure 3
Figure 3. PD-L1 expressed on edited T3 sarcoma cells prevents their immune elimination
A) T3ΔPDL1-PDL1 cells express high levels of PD-L1 constitutively. In vitro PD-L1 and MHC class I (H2-Db) expression on cells treated with IFNγ. Black: isotype control, blue: untreated, red: IFNγ-treated. Data are shown from at least two independent experiments. B) In vivo tumor growth of mock-transduced T3WT cells (T3WT-Mock), mock-transduced T3ΔPDL1.1 cells (T3ΔPDL1-Mock), and T3ΔPDL1.1 cells with enforced PD-L1 expression (T3ΔPDL1-PDL1) in WT or Rag2−/− mice. Tumor cells (0.5 × 10⁶) were injected subcutaneously on day 0 in the mice. Mice bearing T3ΔPDL1-PDL1 cells were left untreated or treated with anti-PD-1 (4H2). Data are shown by mean ± s.e.m from at least two independent experiments (n = 5).
Figure 4
Figure 4. Ablation of PD-L1 in the edited F244 MCA sarcoma and MC38 colorectal carcinoma leads to augmented growth inhibition in WT mice
A) Top: In vivo tumor growth of edited F244 MCA sarcoma cells in WT mice. Tumor-bearing mice were left untreated or treated with anti-PD-1 (RMP1-14) or anti-PD-L1 mAb (10F.9G2). Data are shown by mean ± s.e.m from at least two independent experiments (n=5). Bottom: Numbers of PD-L1 molecules on tumor (CD45) and immune cells (CD45+) in vivo. Data are shown by mean ± s.e.m from two independent experiments (n = 4). B) In vitro PD-L1 and MHC class I (H2-Kb) expression on F244 tumor lines lacking PD-L1 expression (F244ΔPDL1.1-F244ΔPDL1.3) treated with IFNγ were analyzed by flow cytometry. Black: isotype control, blue: untreated, red: IFNγ treated. Data are shown from at least two independent experiments. C) In vivo tumor growth of F244WT and F244ΔPDL1 lines in syngeneic 129S6 WT (black) or Rag2−/− mice (red). Each panel represents data from 2–3 independent experiments. Numbers in parentheses show tumor-free WT mice / total WT mice on day 50 post-transplantation. D) In vivo tumor growth of MC38WT and MC38ΔPDL1 lines in C57BL/6J WT mice. Tumor cells (0.5 × 10⁶) were injected subcutaneously on day 0 in the mice. Mice injected with MC38WT cells were treated on day 7 post-implantation with control or anti-PD-1 mAb (4H2). Numbers in parentheses show tumor-free WT mice / total WT mice on day 45 post-transplantation. MC38WT, but not MC38ΔPDL1, cells upregulated PD-L1 expression in vitro after IFNγ stimulation as evidenced by flow cytometry. Data shown in this figure is representative of at least two independent experiments (n = 10).
Figure 5
Figure 5. Physiologic levels of PD-L1 are not sufficient to prevent immune elimination of highly immunogenic unedited T9 sarcoma cells
A) In vitro PD-L1 expression with or without IFNγ on T9 sarcoma cells constitutively expressing ectopic PD-L1 either at physiologic levels comparable to that induced by IFNγ on parental T9 cells (T9-PDL1phy) or those at high level over-expression (T9-PDL1ovr). Data are shown from at least three independent experiments. B) Numbers of PD-L1 molecules expressed on cells after IFNγ treatment in vitro. Data are shown by mean ± s.e.m of technical triplicates from at least three independent experiments. C) In vivo growth of three clones of T9-PDL1phy or T9-PDL1ovr cells in WT mice. Data are shown by mean ± s.e.m from at least two independent experiments (n = 5). D) Anti-PD-1 (4H2) or anti-PD-L1 (14D8) leads to tumor rejection in T9-PDL1ovr-bearing mice. Data are shown by mean ± s.e.m from two independent experiments (n = 5). E) In vitro cytotoxicity assay of mutant Spectrin-b2-specific CTL (C3) against tumor cells with anti-PD-1(4H2)/anti-PD-L1(14D8) blockade. Data are shown by mean ± s.e.m of technical triplicates (T9, T3) and duplicates (T9-PDL1ovr, T9-PDL1phy) from at least two independent experiments. F) In vitro IFNγ secretion from mutant Spectrin-b2-specific CTL (C3) against tumor cells with or without anti-PD-L1 (14D8). Data are shown by mean ± s.e.m of technical triplicates from at least two independent experiments. Samples in E, F were compared using an unpaired, two-tailed Student t test. **P < 0.01, *P < 0.05.
Figure 6
Figure 6. H31m1-PDL1 cells form progressively growing tumors in WT mice
A) Left: In vivo tumor growth of unedited H31m1 MCA sarcoma cells in WT mice. Mice bearing H31m1 cells were left untreated. Data are shown by mean ± s.e.m from at least two independent experiments (n = 5). Right: Numbers of PD-L1 molecules on tumor (CD45) and immune cells (CD45+) in vivo. Data are shown by mean ± s.e.m from two independent experiments (n = 4). B) In vitro PD-L1 expression on cells treated with or without IFNγ (100 ng ml−1) for 24 h. Data are shown from at least two independent experiments. Red: unstained, blue: isotype control, orange: anti-PD-L1. C) In vivo tumor growth of H31m1 parental and H31m1-PDL1 tumor cells in WT mice. Tumor cells (10 × 106) were injected on day 0. Data shown in this figure is representative of at least two independent experiments (n = 20).
Figure 7
Figure 7. Host PD-L1 participates in inhibiting immune elimination of T3 sarcoma cells through distinct regulatory machineries
A) Percentage of progressively growing T3ΔPDL1.1 tumors in WT mice treated either with control mAb or anti-PD-L1. Numbers represent mice with progressively growing tumors / all mice injected with the indicated number of tumor cells on day 0. Data are shown from at least two independent experiments. B) Treatment of WT mice with anti-PD-L1 (10F.9G2) leads to rejection of 10 × 106 T3ΔPDL1.1 cells. Data are shown by mean ± s.e.m from two independent experiments (n=5). C) PD-L1 expression on tumor cells and TAMs in T3 tumors on days 9 and 12. Mice were treated with anti-IFNγ neutralizing mAb (0.25 mg/mouse) on days -1 and 6, and injected with T3 sarcoma cells on day 0. Red: isotype, blue: untreated mice, orange: mice treated with anti-IFNγ. Data are shown from three independent experiments. D) Absolute numbers of PD-L1 molecules expressed on cell types in pooled three T3 tumors on days 9 and 12. Data are shown by mean ± s.e.m from three independent experiments (n = 3). E) A large proportion of PD-L1 molecules on TAMs are IFNγ independent. Mice were treated with anti-IFNγ neutralizing mAb (2.0 mg/mouse) either on days -1 and 6, or on day 9, and injected with T3 sarcoma cells on day 0. PD-L1 expression on tumor cells and TAMs was analyzed on day 12. Data are shown by mean ± s.e.m from three independent experiments (n = 6). F) CD4+ T cells contribute to PD-L1 expression on TAMs in the absence of IFNγ. F244 sarcoma cells were injected into either WT or Rag2−/− mice. WT Mice were left untreated or treated with anti-IFNγ neutralizing mAb, anti-CD4 mAb, anti-CD8 mAb, or the combination. PD-L1 expression on tumor cells and macrophages in the tumors was analyzed on day 8. Data are shown by mean ± s.e.m from at least two independent experiments (n = 3). Data in D, E, F were compared using one-way ANOVA followed by multiple comparison test. N.S., not significant; ****P < 0.0001, **P < 0.01, *P < 0.05.

References

    1. Dong H, Strome SE, Salomao DR, Tamura H, Hirano F, Flies DB, et al. Tumor-associated B7-H1 promotes T-cell apoptosis: A potential mechanism of immune evasion. Nature Medicine. 2002;8:793–800. - PubMed
    1. Iwai Y, Ishida M, Tanaka Y, Okazaki T, Honjo T, Minato N. Involvement of PD-L1 on tumor cells in the escape from host immune system and tumor immunotherapy by PD-L1 blockade. Proceedings of the National Academy of Sciences. 2002;99:12293–7. - PMC - PubMed
    1. Borghaei H, Paz-Ares L, Horn L, Spigel DR, Steins M, Ready NE, et al. Nivolumab versus Docetaxel in Advanced Nonsquamous Non-Small-Cell Lung Cancer. N Engl J Med. 2015;373:1627–39. - PMC - PubMed
    1. Garon EB, Rizvi NA, Hui R, Leighl N, Balmanoukian AS, Eder JP, et al. Pembrolizumab for the Treatment of Non–Small-Cell Lung Cancer. N Engl J Med. 2015;372:2018–28. - PubMed
    1. Rittmeyer A, Barlesi F, Waterkamp D, Park K, Ciardiello F, von Pawel J, et al. Atezolizumab versus docetaxel in patients with previously treated non-small-cell lung cancer (OAK): a phase 3, open-label, multicentre randomised controlled trial. The Lancet. 2016 online first. - PMC - PubMed

Publication types

MeSH terms