. 2017 Mar 1;140(3):655-668.
doi: 10.1093/brain/aww322.

Dynamics of convulsive seizure termination and postictal generalized EEG suppression

Affiliations

Dynamics of convulsive seizure termination and postictal generalized EEG suppression

Prisca R Bauer et al. Brain. .

Abstract

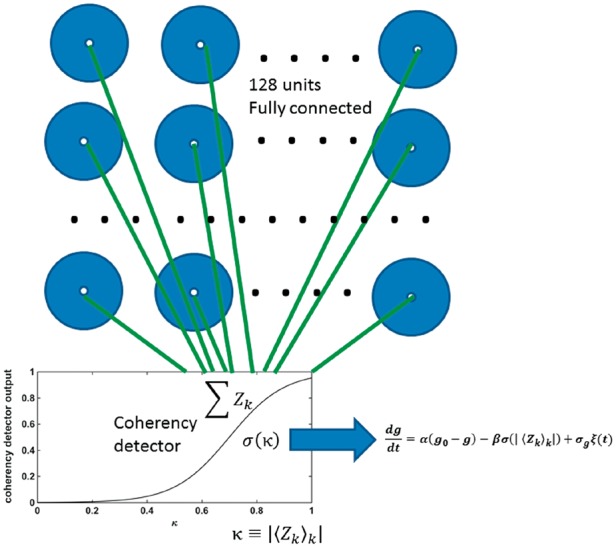
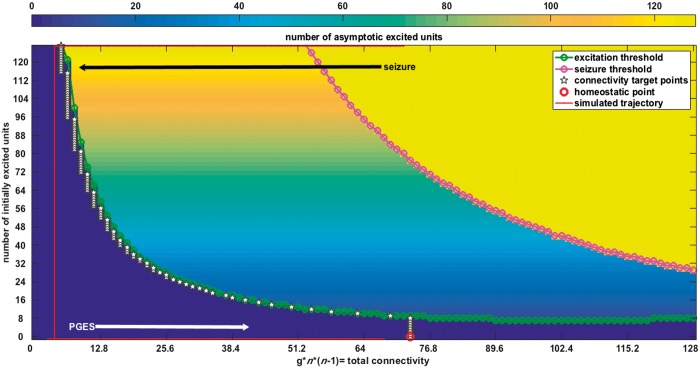
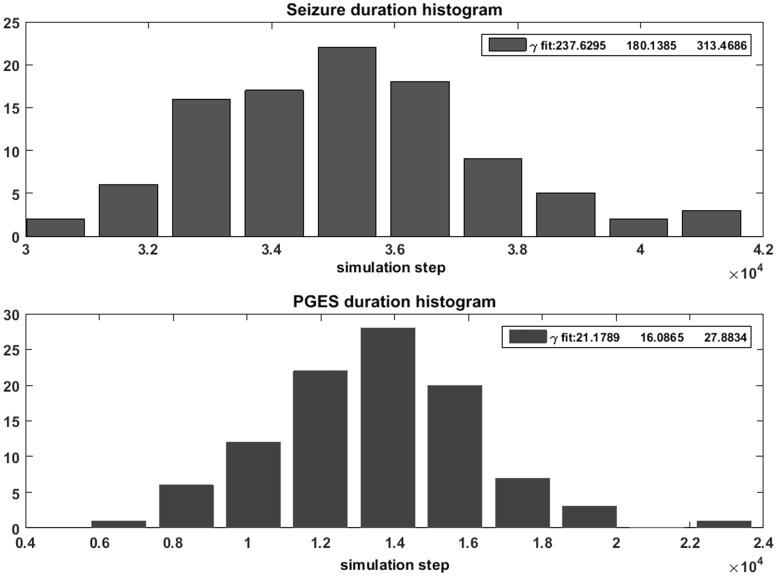
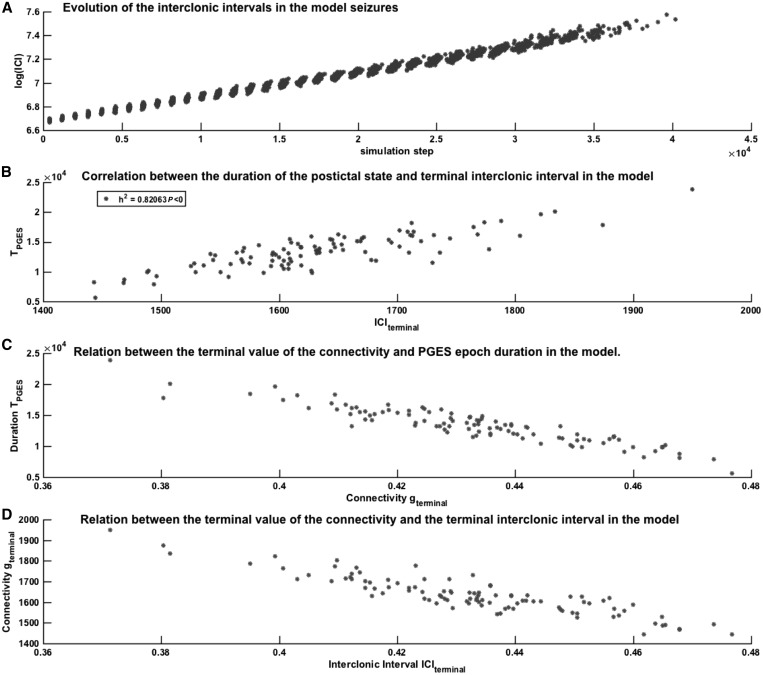
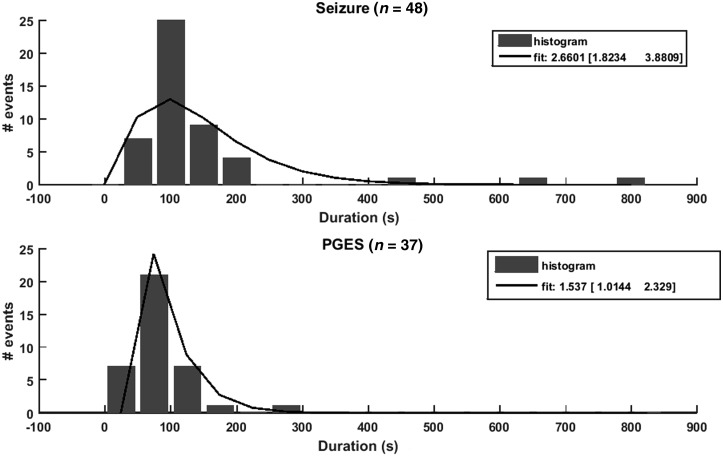
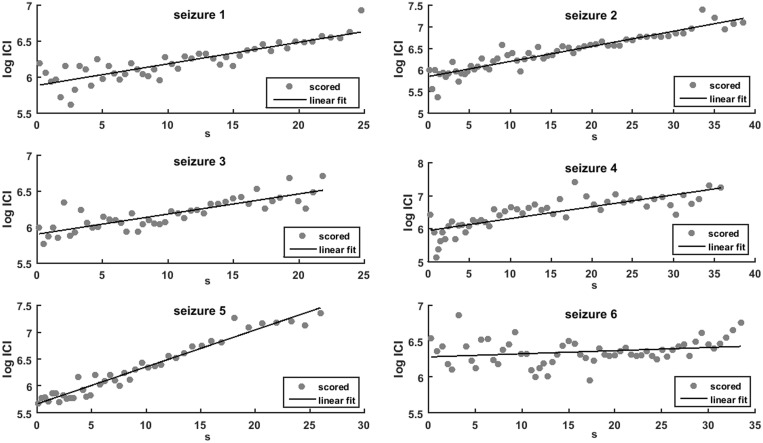
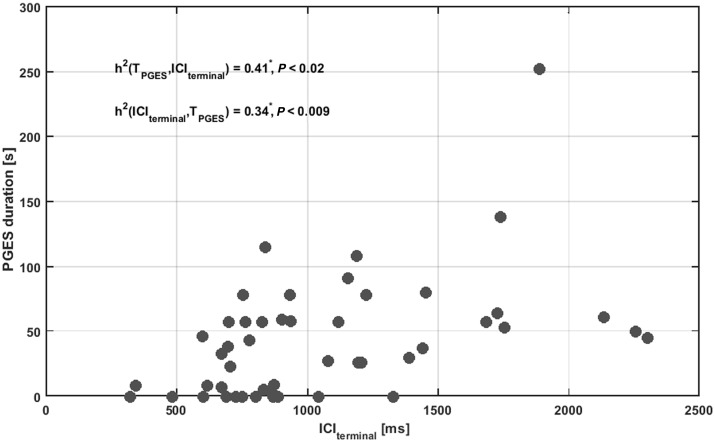
It is not fully understood how seizures terminate and why some seizures are followed by a period of complete brain activity suppression, postictal generalized EEG suppression. This is clinically relevant as there is a potential association between postictal generalized EEG suppression, cardiorespiratory arrest and sudden death following a seizure. We combined human encephalographic seizure data with data of a computational model of seizures to elucidate the neuronal network dynamics underlying seizure termination and the postictal generalized EEG suppression state. A multi-unit computational neural mass model of epileptic seizure termination and postictal recovery was developed. The model provided three predictions that were validated in EEG recordings of 48 convulsive seizures from 48 subjects with refractory focal epilepsy (20 females, age range 15-61 years). The duration of ictal and postictal generalized EEG suppression periods in human EEG followed a gamma probability distribution indicative of a deterministic process (shape parameter 2.6 and 1.5, respectively) as predicted by the model. In the model and in humans, the time between two clonic bursts increased exponentially from the start of the clonic phase of the seizure. The terminal interclonic interval, calculated using the projected terminal value of the log-linear fit of the clonic frequency decrease was correlated with the presence and duration of postictal suppression. The projected terminal interclonic interval explained 41% of the variation in postictal generalized EEG suppression duration (P < 0.02). Conversely, postictal generalized EEG suppression duration explained 34% of the variation in the last interclonic interval duration. Our findings suggest that postictal generalized EEG suppression is a separate brain state and that seizure termination is a plastic and autonomous process, reflected in increased duration of interclonic intervals that determine the duration of postictal generalized EEG suppression.

Keywords: SUDEP; clonic slowing; critical slowing down; epilepsy.


Figures

Figure 1
Figure 1
Schematic representation of the model neuronal network. The model consists of 128 fully interconnected units, representing neuronal lumps including pyramidal neurons and interneurons. Any two units are equally interconnected. The collective output of all units is filtered through a sigmoid function or coherency detector (input-output function in inset and Equation 2). The horizontal axis represents the collective output of the model, the vertical axis is the detector response. The output of the coherency detector is used as input for the dynamics of the connectivity parameter g, which is common for all units.
Figure 2
Figure 2
Output from the computational model. Results from simulations of the system (Equation 1). The system output is generated for 129 values of the connectivity parameter g, ranging from 0 to 128 on the horizontal axis, and for 0 to 128 initially excited units, indicated on the vertical axis. The background colour represents the number of excited units that remain self-sustained according to the dynamics of the coupled system of oscillators. All simulations were first done without noisy input and without changes of the connectivity parameter g. The blue region corresponds to a non-excitable state (‘postictal’); yellow to a limit cycle state (total synchronization or ‘seizure’); and the gradually coloured state in the middle, to ‘normal functioning’, where the system sustains its initial state. Introduction of noise and plasticity of connectivity g through the coherence detector (Equation 2), makes the system transition between the different states (red line). The model simulation starts in a ‘seizure’ state. The connectivity parameter g is activated above a certain level of synchrony (the input from the coherency detector from Fig. 1). This ‘seizure’-induced plasticity of the connectivity parameter g causes termination of the ‘seizure’ and drives the return through a ‘postictal’ period to the ‘normal’ state which we defined as an excitability threshold 50% higher than that of the homeostatic point, indicated in red.
Figure 3
Figure 3
Gamma distributions of ictal, postictal and normal period durations in the model. Histograms and fitted gamma functions for the distributions of the ‘seizure’ (top) and ‘postictal’ (bottom) durations as simulated using the model. The estimation of the shape parameter α for the fitted gamma-distribution as well as the 95% CIs are presented in the text boxes. The data were obtained using the standard MatLab® function gamfit.
Figure 4
Figure 4
Relation between the interclonic interval, connectivity and PGES in the model. (A) Scatter plot showing the relation between the ICI (vertical axis, logarithmic scale) determined by the strength of the connectivity parameter g during simulated seizures and the time elapsed since the beginning of the simulated seizure (horizontal axis, in simulation steps). The different data points at each time point represent different simulations. The figure shows that the interclonic interval is relatively constant at the start of the model seizure, but varies at the end of the seizure. (B) The relation between the model terminal interclonic interval (ICIterminal, horizontal axis) value and the duration of the PGES state in the model (vertical axis). The non-linear correlation coefficient h2 shows that the terminal interclonic interval value explains 82% of the variability of the PGES duration. (C) Scatter plot showing the relation between the durations of the simulated PGES states (vertical axis, in simulation steps) and the value of the connectivity parameter g at the end of the preceding seizure (horizontal axis, dimensionless units). (D) the relationship between the terminal value of the connectivity parameter g and the terminal interclonic interval in the model.
Figure 5
Figure 5
Gamma distribution of ictal and PGES period durations in human EEG data. Histograms and fitted gamma functions (solid lines) for the distributions of the seizure (top) and PGES (bottom) durations as visually detected from the human EEG recordings. The three numbers in the legends give the parameter α (from Equation 3) for the fitted gamma-distribution and the corresponding 95% CI as obtained from the standard MatLab® function gamfit.
Figure 6
Figure 6
Linear fit of the interclonic interval in human seizures. Scatter plots of interclonic intervals (circles) and best linear fit (solid line) between the time from the beginning of the convulsive phase (in seconds, horizontal axis) and the logarithm of the interclonic intervals [log(ICI), vertical axis]. The figure illustrates the six first seizures from the dataset, the fitting algorithm was applied to all 48 cases.
Figure 7
Figure 7
Relation between interclonic interval and postictal period duration in EEG recordings. Scatter plot showing the relation between the terminal interclonic interval (ICIterminal) values (in milliseconds, horizontal axis) and PGES duration (in seconds, vertical axis). Convulsive seizures that were not followed by a PGES event were accounted as 0 s. The non-linear association index h2 was determined and shows a relatively small, but statistically significant functional relation (P < 0.05, indicated by an asterisk) between PGES duration and ICIterminal in both directions.

References

    1. Aiba I, Noebels JL. Spreading depolarization in the brainstem mediates sudden cardiorespiratory arrest in mouse SUDEP models. Sci Transl Med 2015; 7: 282ra46. - PMC - PubMed
    1. Beniczky S, Conradsen I, Moldovan M, Jennum P, Fabricius M, Benedek K. et al. Quantitative analysis of surface electromyography during epileptic and nonepileptic convulsive seizures. Epilepsia 2014; 55: 1128–34. - PubMed
    1. Boido D, Gnatkovsky V, Uva L, Francione S, de Curtis M. Simultaneous enhancement of excitation and postburst inhibition at the end of focal seizures. Ann Neurol 2014; 76: 826–36. - PubMed
    1. Bozorgi A, Chung S, Kaffashi F, Loparo KA, Sahoo S, Zhang GQ. et al. Significant postictal hypotension: expanding the spectrum of seizure-induced autonomic dysregulation. Epilepsia 2013; 54: e127–30. - PMC - PubMed
    1. Colic S, Wither RG, Zhang L, Eubanks JH, Bardakjian BL. Characterization of seizure-like events recorded in vivo in a mouse model of Rett syndrome. Neural Netw 2013; 46: 109–15. - PubMed

Publication types