

Unsupervised Clustering of Quantitative Image Phenotypes Reveals Breast Cancer Subtypes with Distinct Prognoses and Molecular Pathways
- PMID: 28073839
- PMCID: PMC5496801
- DOI: 10.1158/1078-0432.CCR-16-2415
Unsupervised Clustering of Quantitative Image Phenotypes Reveals Breast Cancer Subtypes with Distinct Prognoses and Molecular Pathways
Abstract
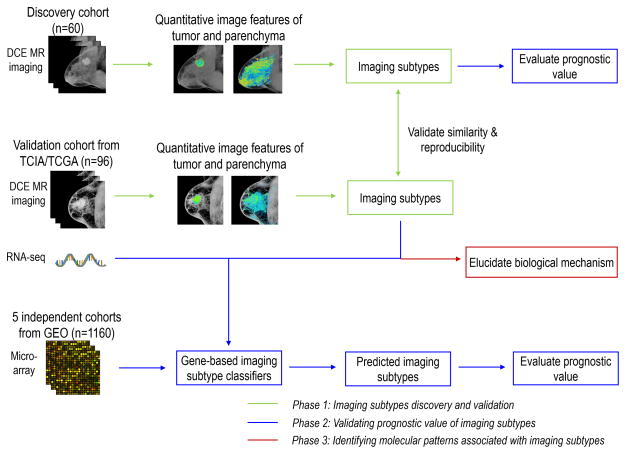
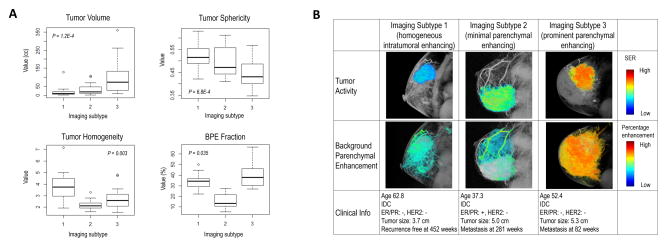
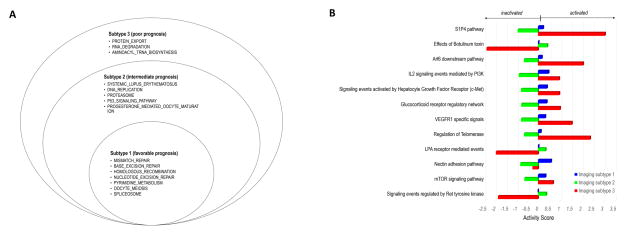
Purpose: To identify novel breast cancer subtypes by extracting quantitative imaging phenotypes of the tumor and surrounding parenchyma and to elucidate the underlying biologic underpinnings and evaluate the prognostic capacity for predicting recurrence-free survival (RFS).Experimental Design: We retrospectively analyzed dynamic contrast-enhanced MRI data of patients from a single-center discovery cohort (n = 60) and an independent multicenter validation cohort (n = 96). Quantitative image features were extracted to characterize tumor morphology, intratumor heterogeneity of contrast agent wash-in/wash-out patterns, and tumor-surrounding parenchyma enhancement. On the basis of these image features, we used unsupervised consensus clustering to identify robust imaging subtypes and evaluated their clinical and biologic relevance. We built a gene expression-based classifier of imaging subtypes and tested their prognostic significance in five additional cohorts with publically available gene expression data but without imaging data (n = 1,160).Results: Three distinct imaging subtypes, that is, homogeneous intratumoral enhancing, minimal parenchymal enhancing, and prominent parenchymal enhancing, were identified and validated. In the discovery cohort, imaging subtypes stratified patients with significantly different 5-year RFS rates of 79.6%, 65.2%, 52.5% (log-rank P = 0.025) and remained as an independent predictor after adjusting for clinicopathologic factors (HR, 2.79; P = 0.016). The prognostic value of imaging subtypes was further validated in five independent gene expression cohorts, with average 5-year RFS rates of 88.1%, 74.0%, 59.5% (log-rank P from <0.0001 to 0.008). Each imaging subtype was associated with specific dysregulated molecular pathways that can be therapeutically targeted.Conclusions: Imaging subtypes provide complimentary value to established histopathologic or molecular subtypes and may help stratify patients with breast cancer. Clin Cancer Res; 23(13); 3334-42. ©2017 AACR.
©2017 American Association for Cancer Research.
Conflict of interest statement
The authors declare no potential conflicts of interest.
Figures


References
-
- Hammond ME, Hayes DF, Dowsett M, Allred DC, Hagerty KL, Badve S, et al. American Society of Clinical Oncology/College Of American Pathologists guideline recommendations for immunohistochemical testing of estrogen and progesterone receptors in breast cancer. J Clin Oncol. 2010;28(16):2784–95. - PMC - PubMed
-
- Harris LN, Ismaila N, McShane LM, Andre F, Collyar DE, Gonzalez-Angulo AM, et al. Use of biomarkers to guide decisions on adjuvant systemic therapy for women with early-stage invasive breast cancer: American Society of Clinical Oncology clinical practice guideline. J Clin Oncol. 2016:JCO652289. - PubMed
-
- Sotiriou C, Pusztai L. Gene-expression signatures in breast cancer. New Engl J Med. 2009;360(8):790–800. - PubMed
-
- Voduc KD, Cheang MC, Tyldesley S, Gelmon K, Nielsen TO, Kennecke H. Breast cancer subtypes and the risk of local and regional relapse. J Clin Oncol. 2010;28(10):1684–91. - PubMed
Publication types
MeSH terms
Substances
Grants and funding
LinkOut - more resources
Full Text Sources
Other Literature Sources
Medical
