. 2017 Jun;28(6):1753-1768.
doi: 10.1681/ASN.2016080925. Epub 2017 Jan 10.

Histones and Neutrophil Extracellular Traps Enhance Tubular Necrosis and Remote Organ Injury in Ischemic AKI

Affiliations

Histones and Neutrophil Extracellular Traps Enhance Tubular Necrosis and Remote Organ Injury in Ischemic AKI

Daigo Nakazawa et al. J Am Soc Nephrol. 2017 Jun.

Abstract

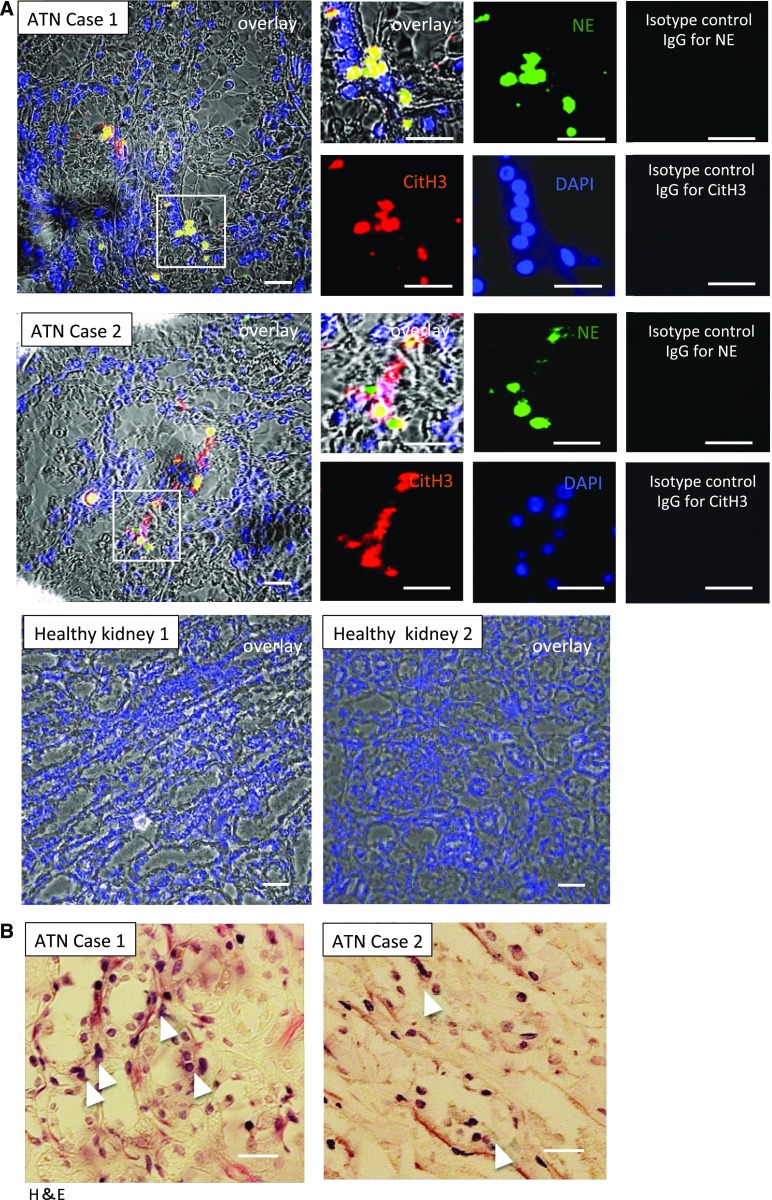
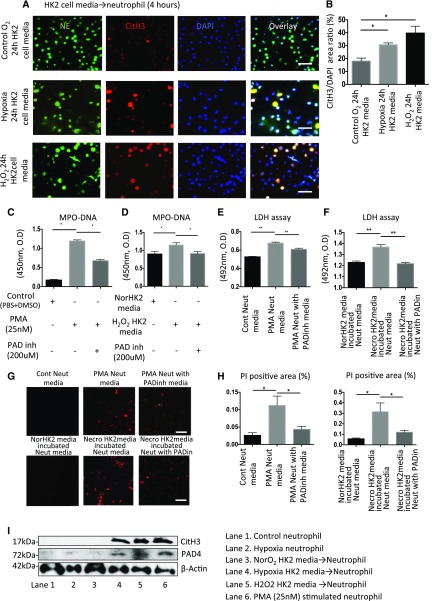
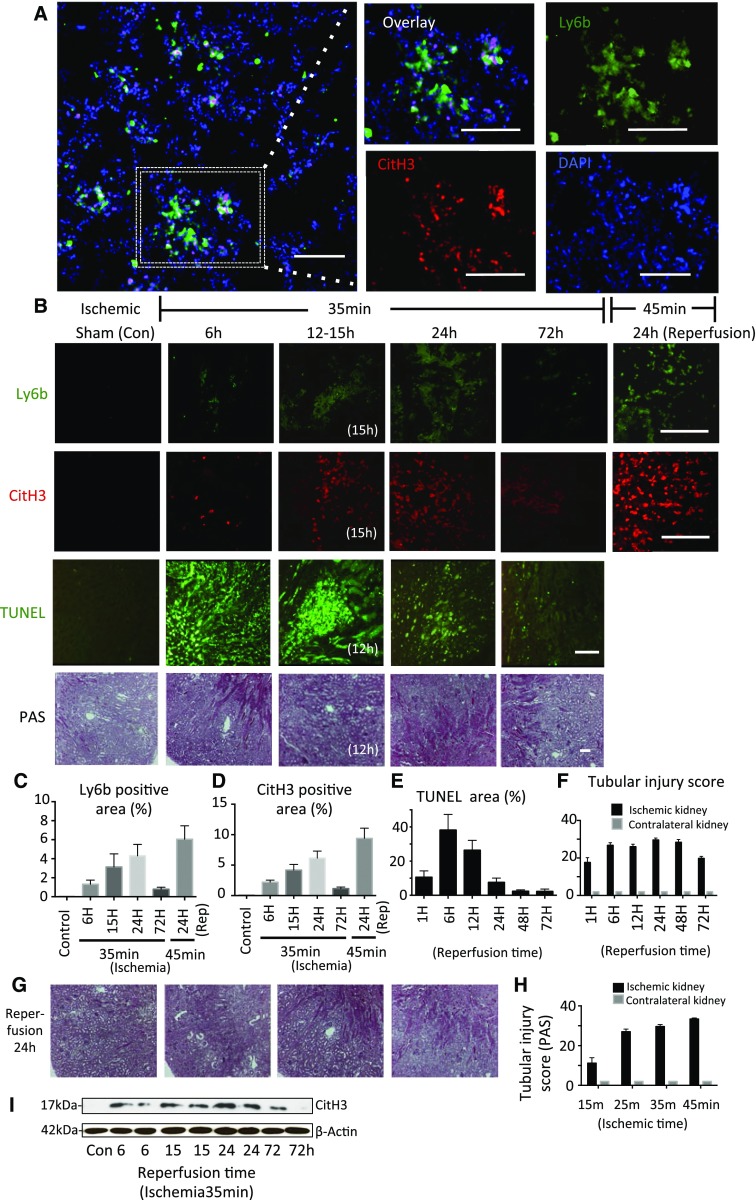
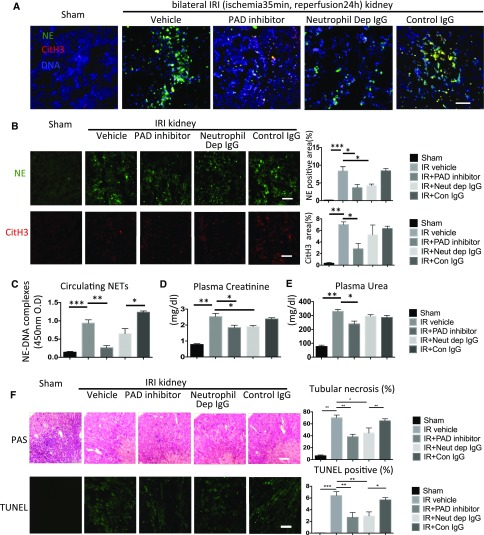
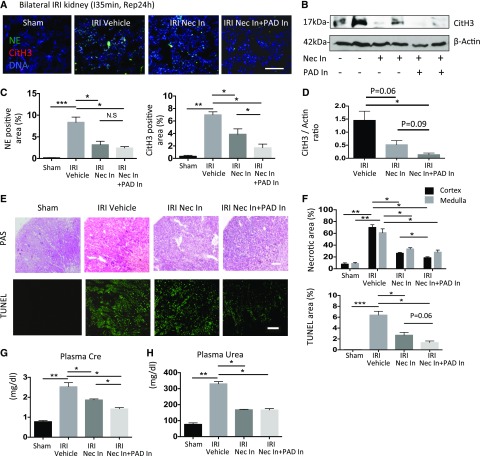
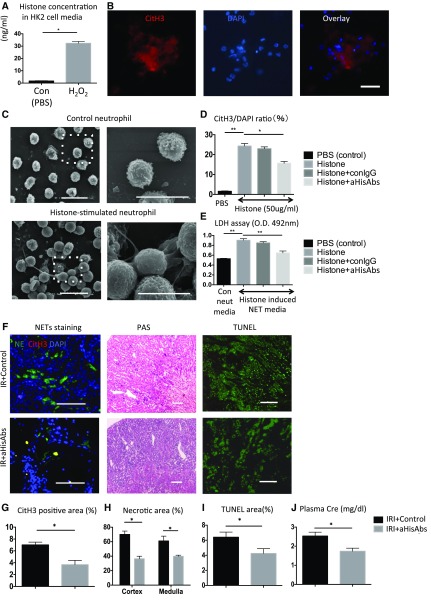
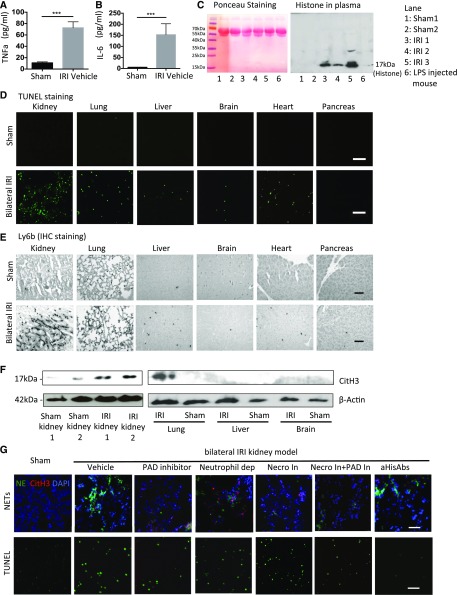
Severe AKI is often associated with multiorgan dysfunction, but the mechanisms of this remote tissue injury are unknown. We hypothesized that renal necroinflammation releases cytotoxic molecules that may cause remote organ damage. In hypoxia-induced tubular epithelial cell necrosis in vitro, histone secretion from ischemic tubular cells primed neutrophils to form neutrophil extracellular traps. These traps induced tubular epithelial cell death and stimulated neutrophil extracellular trap formation in fresh neutrophils. In vivo, ischemia-reperfusion injury in the mouse kidney induced tubular necrosis, which preceded the expansion of localized and circulating neutrophil extracellular traps and the increased expression of inflammatory and injury-related genes. Pretreatment with inhibitors of neutrophil extracellular trap formation reduced kidney injury. Dual inhibition of neutrophil trap formation and tubular cell necrosis had an additive protective effect. Moreover, pretreatment with antihistone IgG suppressed ischemia-induced neutrophil extracellular trap formation and renal injury. Renal ischemic injury also increased the levels of circulating histones, and we detected neutrophil infiltration and TUNEL-positive cells in the lungs, liver, brain, and heart along with neutrophil extracellular trap accumulation in the lungs. Inhibition of neutrophil extracellular trap formation or of circulating histones reduced these effects as well. These data suggest that tubular necrosis and neutrophil extracellular trap formation accelerate kidney damage and remote organ dysfunction through cytokine and histone release and identify novel molecular targets to limit renal necroinflammation and multiorgan failure.

Keywords: AKI related remote organ injury; Ischemic reperfusion injury; NETs; necroinflammation; tubular cell death.


Figures

Figure 1.
Figure 1.
NETs in human kidney biopsies with severe acute tubular necrosis. NET immunostaining in renal allograft biopsies with ATN (n=2) and healthy kidney samples (n=2). (A) Blue and overlay with phase contrast, 49,6-diamidin-2-phenylindol (DAPI) staining; green, NE; red, CitH3. (Right panel) The staining by isotype control IgG for NE and CitH3 is negative. NE/CitH3-positive NETs in tubulointerstitial space (top panel: ATN case 1, middle panel: ATN case 2). Bottom panels show the overlay of NETs staining in two healthy kidney samples. (B) H&E staining shows leukocyte infiltration into surrounding tubules (left panel: ATN case 1; right panel: ATN case 2). Scale bar, 25 μm.
Figure 2.
Figure 2.
NETs initiate the necroinflammation loop in vitro. (A and B) HK-2 cells were incubated with normal oxygen, hypoxia (1% O2), or 1 mM H2O2 for 24 hours, and the cell culture supernatants were incubated with healthy human neutrophils for 4 hours. The NETs are detected by immunofluorescence staining. Blue, 49,6-diamidin-2-phenylindol (DAPI) staining; green, NE; red, CitH3. Scale bar, 50 μm. The graph of B shows the ratio of CitH3 to DAPI-positive area. (C–H) Neutrophils were treated with (C) 25 nM PMA and (D) necrotic tubular cells media in the presence or absence of PAD inhibitor (200 μM). NETs in the culture supernatants were quantified by MPO-DNA complexes ELISA. NET supernatant after treatment with PMA and necrotic tubular cells media were incubated with healthy tubular epithelial cells for 20 hours, and the cytotoxicity of tubular epithelial cells was evaluated with (E and F) LDH assay and (G) propidium iodide (PI) staining. Upper and lower panels in G show the PI positivity of PMA NETs–stimulated HK-2 cells and necrotic media–mediated NETs-stimulated HK-2 cells, respectively. (H) The quantification of G. The conditioned NET media were prepared by replacing with fresh media to avoid the contamination of PMA and tubular cell necrotic media as previously described. Scale bar, 200 μm. (I) The expression of CitH3 and PAD4 of neutrophils treated with normal oxygen or hypoxia condition or different tubular epithelial cells necrotic media were detected by immunoblotting with β-actin as a loading control. As a positive control of CitH3 expression, neutrophils were treated with 25 nM PMA. Data represent the mean±SEM of three to six independent experiments and were analyzed using the paired t test. *P<0.05 versus respective control; **P<0.01 versus respective control.
Figure 3.
Figure 3.
NETs in the mouse kidney with acute injury. (A) Representative NETs staining in outer medullary lesions of unilateral IRI kidney (ischemia for 35 minutes and reperfusion for 24 hours). Colocalization of CitH3 (red), Ly6b (green), and swelled nuclei (blue) surrounding tubular duct indicates the NETs formation. Scale bar, 50 μm. (B) Histology of unilateral IRI kidney at different time points after reperfusion and different ischemia times. (Row 1) Ly6b (green). (Row 2) CitH3 (red). (Row 3) TUNEL (green). (Row 4) Periodic acid–Schiff (PAS) staining. Scale bar, 200 μm. (C) Ly6b-positive area, (D) CitH3-positive area, (E) TUNEL-positive area, and (F) histologic evaluation of PAS staining at different times. (G) Representative image and (H) tubular injury score at different ischemic times. (I) CitH3 expression of unilateral IRI kidney by immunoblotting. Data are mean±SEM from five mice in each group.
Figure 4.
Figure 4.
NET inhibitor ameliorates bilateral IRI kidney. Bilateral IRI kidney model mice (ischemia for 35 minutes and reperfusion for 24 hours) were treated with vehicle (20% DMSO in PBS; n=14), PAD inhibitor (Cl-amidine: 20 mg/kg intraperitoneally; n=5), and neutrophil depletion by injection of anti-Ly6G mAb (500 μg anti-Ly6G IgGs; n=10 or control IgGs; n=5) 24 and 2 hours before the surgery. Sham-operated mice were prepared as a control (n=5). (A) Representative overlay images of NETs staining in each group. Blue, 49,6-diamidin-2-phenylindol (DAPI); green, NE; red, CitH3. B, upper panel shows NE staining and the ratio of NE-positive area. B, lower panel shows CitH3 staining and the ratio of CitH3-positive area in different treatment group. Scale bar, 100 μm. (C) Circulating NETs, (D) plasma creatinine, and (E) plasma urea level in each group. (F) Histologic findings and TUNEL staining. Upper panel shows representative periodic acid–Schiff (PAS) staining and tubular necrosis area, respectively. Lower panel shows representative TUNEL staining and the ratio of TUNEL-positive area. Data are mean±SEM from at least five mice in each group. Scale bar, 500 μm in F, upper panel; 200 μm in F, lower panel. *P<0.05 versus respective control; **P<0.01 versus respective control; ***P<0.01 versus respective control.
Figure 5.
Figure 5.
NET inhibition had additional protection on necrosis inhibition in the IRI kidney. Bilateral IRI kidney model mice (ischemia for 35 minutes and reperfusion for 24 hours) were treated with vehicle (20% DMSO in PBS; n=14), necrosis inhibitor cocktail (Necrostatin-1: 1.65 mg/kg intraperitoneally; Ferrostatin-1: 2 mg/kg intraperitoneally; cyclosporine: 10 mg/kg intravenously; n=5), and the combination necrosis inhibitor cocktail and PAD inhibitor (Cl-amidine: 20 mg/kg intraperitoneally; n=5) before the surgery. (A) Representative NETs staining in IRI kidney treated with vehicle, necrosis inhibitor cocktail (Nec In), and the combination Nec In and PAD inhibitor (PAD In). Blue, 49,6-diamidin-2-phenylindol; green, NE; red, CitH3. Scale bar, 200 μm. (B) Representative protein expression of CitH3 in IRI kidneys treated with different inhibitors and (D) the quantification normalized to β-actin expression. C, left panel shows the NE-positive area, and C, right panel shows the CitH3-positive area. (E) Representative periodic acid–Schiff (PAS) and TUNEL staining. Scale bar, 500 μm in upper panel; 200 μm in lower panel. (F) The quantification of necrotic area in PAS staining (upper panel) and TUNEL-positive area (lower panel). (G) Plasma creatinine and (H) plasma urea in each group. Data are mean±SEM from at least five mice in each group. *P<0.05 versus respective control; **P<0.01 versus respective control; ***P<0.01 versus respective control.
Figure 6.
Figure 6.
Histones are central key players of necroinflammation, including NETosis. (A) Histone concentration of the supernatant in HK-2 cells treated with 1 mM H2O2 and PBS for 24 hours was measured by the histone detection ELISA kit. Data represent the mean±SEM of four independent experiments. *P<0.05 versus respective control. (B–D) Human health neutrophils were incubated with exogenous histones (50 μg/ml) or control PBS for 3 hours. (B) Representative NETs staining of histone-stimulated neutrophils using CitH3 (red) and 49,6-diamidin-2-phenylindol (DAPI; blue). Scale bar, 50 μm. (C) Representative scanning electron microscopy images of unstimulated neutrophils (upper panel) and histone-stimulated neutrophils (lower panel). Scale bar, 20 μm. (D) Neutrophils were treated with histones (50 μg/ml) in the presence of aHisAbs (100 μg/ml) or control Abs (100 μg/ml), and the ratio of CitH3-positive cells was quantified. (E) The supernatants of histones-stimulated neutrophils were applied to HK-2 cells, and the cytotoxicity was determined by LDH assay. The conditioned media were prepared as previously described to avoid the contamination of external histones. Data represent the mean±SEM of four independent experiments. *P<0.05 versus respective control; **P<0.01 versus respective control. (F) Representative images of (left panel) NETs, (center panel) periodic acid–Schiff (PAS), and (right panel) TUNEL staining in IRI kidney treated with (upper panel) control and (lower panel) aHisAbs (20 mg/kg intraperitoneally; n=5). Blue, DAPI; green, NE; red, CitH3. Scale bar, 200 μm. The quantification of (G) CitH3-positive NETs area, (H) histologic necrotic area, and (I) TUNEL-positive area. (J) Plasma creatinine in IRI kidney mice treated with control and aHisAbs. Data show the mean±SEM from at least five mice in each group. *P<0.05 versus respective control.
Figure 7.
Figure 7.
AKI-related remote organ injury is caused by circulating NETs and DAMPs, such as histones. (A) Plasma TNF-α, (B) IL-6, and (C) histone 3 content in sham-operated mice and bilateral IRI kidney mice (ischemia for 35 minutes and reperfusion for 24 hours) was measured by (A and B) ELISA and (C) immunoblotting methods. As a positive control for plasma histone, the plasma of LPS-induced sepsis mice was used. (D) Tissue injury, (E) neutrophil infiltration, and (F) NETs expression in multiorgan (kidney, lung, liver, brain, heart, and pancreas) sham and bilateral IRI (ischemia for 35 minutes and reperfusion for 24 hours) kidney mice were evaluated by TUNEL staining, Ly6b immunostaining, and immunoblotting, respectively. (G) Lung injury followed by bilateral IRI kidney (ischemia for 35 minutes and reperfusion for 24 hours) treated with vehicle, PAD inhibitor, neutrophil depletion, necrosis inhibitor, necrosis inhibitor and PAD inhibitor, or aHisAbs was evaluated by (upper panel) NETs immunostaining (blue, 49,6-diamidin-2-phenylindol [DAPI]; green, NE; red, CitH3) and (lower panel) TUNEL staining (lower figures). The graphs show (H) NETs area and (I) TUNEL-positive area in lung. (J) The cell number in BAL of these groups was counted. (K–M) The quantification of TUNEL-positive area in (K) liver, (L) heart, and (M) brain in each group. (N) Plasma TNF-α and (O) IL-6 in differently treated mice were measured by ELISA method. Data show the mean±SEM from at least five mice in each group. Scale bar, 100 μm. *P<0.05 versus respective control; **P<0.01 versus respective control; ***P<0.01 versus respective control; #P<0.05 compared with aHisAbs group.

Comment in

Similar articles

Cited by

References

    1. Libório AB, Leite TT, Neves FM, Teles F, Bezerra CT: AKI complications in critically ill patients: Association with mortality rates and RRT. Clin J Am Soc Nephrol 10: 21–28, 2015 - PMC - PubMed
    1. Sharfuddin AA, Molitoris BA: Pathophysiology of ischemic acute kidney injury. Nat Rev Nephrol 7: 189–200, 2011 - PubMed
    1. Mulay SR, Linkermann A, Anders HJ: Necroinflammation in kidney disease. J Am Soc Nephrol 27: 27–39, 2016 - PMC - PubMed
    1. Linkermann A, Stockwell BR, Krautwald S, Anders HJ: Regulated cell death and inflammation: An auto-amplification loop causes organ failure. Nat Rev Immunol 14: 759–767, 2014 - PubMed
    1. Braza F, Brouard S, Chadban S, Goldstein DR: Role of TLRs and DAMPs in allograft inflammation and transplant outcomes. Nat Rev Nephrol 12: 281–290, 2016 - PMC - PubMed