. 2016:2016:9370565.
doi: 10.1155/2016/9370565. Epub 2016 Dec 15.

Behavior of Oxidative Stress Markers in Alcoholic Liver Cirrhosis Patients

Affiliations

Behavior of Oxidative Stress Markers in Alcoholic Liver Cirrhosis Patients

Marina Galicia-Moreno et al. Oxid Med Cell Longev. 2016.

Abstract

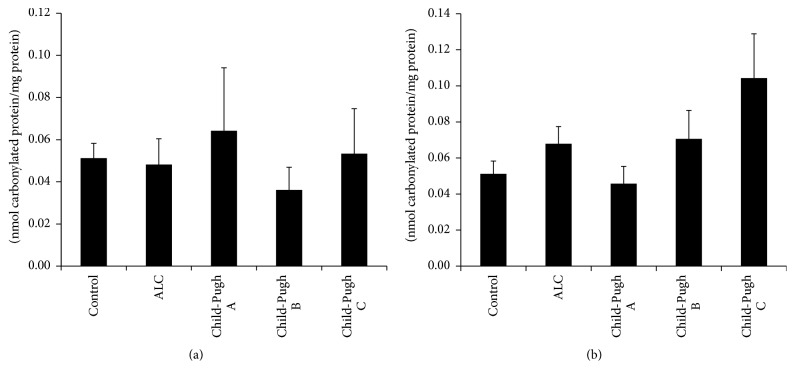
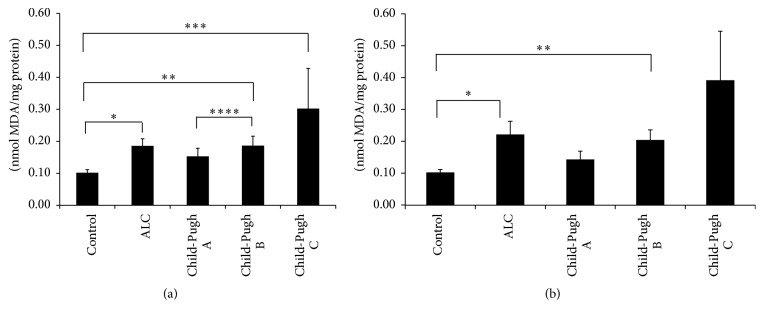
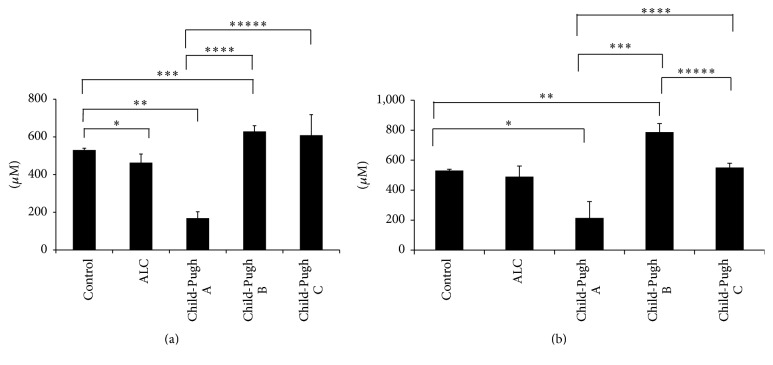
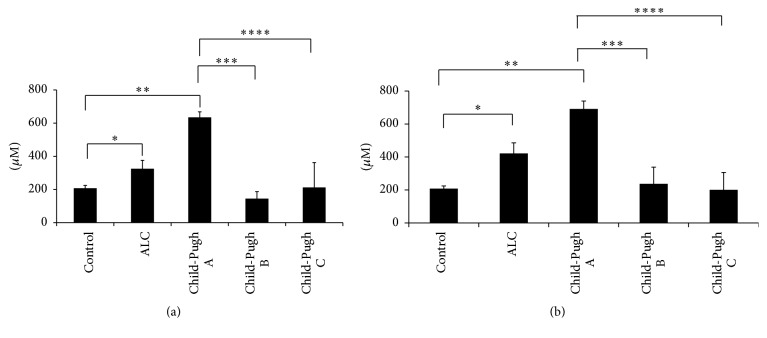
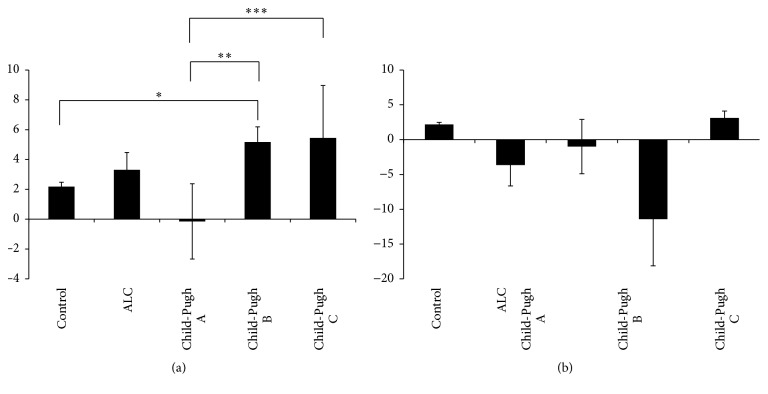
Alcohol is the most socially accepted addictive substance worldwide, and its metabolism is related with oxidative stress generation. The aim of this work was to evaluate the role of oxidative stress in alcoholic liver cirrhosis (ALC). This study included 187 patients divided into two groups: ALC, classified according to Child-Pugh score, and a control group. We determined the levels of reduced and oxidized glutathione (GSH and GSSG) and the GSH/GSSG ratio by an enzymatic method in blood. Also, protein carbonyl and malondialdehyde (MDA) content were estimated in serum. MDA levels increased in proportion to the severity of damage, whereas the GSH and GSSG levels decreased and increased, respectively, at different stages of cirrhosis. There were no differences in the GSH/GSSG ratio and carbonylated protein content between groups. We also evaluated whether the active consumption of or abstinence from alcoholic beverages affected the behavior of these oxidative markers and only found differences in the MDA, GSH, and GSSG determination and the GSH/GSSG ratio. Our results suggest that alcoholic cirrhotic subjects have an increase in oxidative stress in the early stages of disease severity and that abstinence from alcohol consumption favors the major antioxidant endogen: GSH in patients with advanced disease severity.


Conflict of interest statement

The authors declare that they have no competing interests.

Figures

Figure 1
Figure 1
Carbonylated protein determination. Oxidative damage determined as carbonylated protein levels in serum from participants of the control group (control) and patients with alcoholic liver cirrhosis (ALC) classified according to the Child-Pugh score as Child-Pugh A, Child-Pugh B, or Child-Pugh C. (a) Patients without current alcohol consumption; (b) patients with active alcohol consumption. Each bar represents the mean value ± SEM. Differences were considered statistically significant when the p value was less than 0.05.
Figure 2
Figure 2
Evaluation of oxidative damage in lipids. Lipid peroxidation determined as malondialdehyde (MDA) content in serum samples from participants of the control group (control) and patients with alcoholic liver cirrhosis (ALC), classified according to the Child-Pugh score as Child-Pugh A, Child-Pugh B, or Child-Pugh C. (a) Patients without current alcohol consumption; (b) patients with active alcohol consumption. Each bar represents the mean value ± SEM. For (a): p = 0.001, control group versus ALC group; ∗∗ p = 0.004, control group versus Child-Pugh B subgroup; ∗∗∗ p = 0.003, control group versus Child-Pugh C subgroup; ∗∗∗∗ p = 0.049, Child-Pugh A versus Child-Pugh B subgroup. For (b): p = 0.036, control group versus ALC group; ∗∗ p = 0.013, control group versus Child-Pugh B subgroup.
Figure 3
Figure 3
GSH level determination. Reduced glutathione (GSH) content was determined in total blood from participants of the control group (control) and patients with alcoholic liver cirrhosis (ALC), classified according to the Child-Pugh score as Child-Pugh A, Child-Pugh B, or Child-Pugh C. (a) Patients without current alcohol consumption; (b) patients with active alcohol consumption. Each bar represents the mean value ± SEM. For (a): p = 0.022, control group versus ALC group; ∗∗ p = 0.001, control group versus Child-Pugh A subgroup; ∗∗∗ p = 0.001, control group versus Child-Pugh B patients; ∗∗∗∗ p = 0.001, Child-Pugh A versus Child-Pugh B subgroups; ∗∗∗∗∗ p = 0.001, Child-Pugh A subgroup versus Child-Pugh C patients. For (b): p = 0.016, control group versus Child-Pugh A subgroup; ∗∗ p = 0.02, control group versus Child-Pugh B patients; ∗∗∗ p = 0.001, Child-Pugh A versus Child-Pugh B subgroups; ∗∗∗∗ p = 0.012, Child-Pugh A subgroup versus Child-Pugh C patients; ∗∗∗∗∗ p = 0.003, Child-Pugh B patients versus Child-Pugh C subgroup.
Figure 4
Figure 4
GSSG level determination. Oxidized glutathione (GSSG) levels were determined in total blood from participants of the control group (control) and patients with alcoholic liver cirrhosis (ALC), classified according to the Child-Pugh score as Child-Pugh A, Child-Pugh B, or Child-Pugh C. (a) Patients without current alcohol consumption; (b) patients with active alcohol consumption. Each bar represents the mean value ± SEM. For (a): p = 0.008, control group versus ALC group; ∗∗ p = 0.001, control group versus Child-Pugh A subgroup; ∗∗∗ p = 0.001, Child-Pugh A versus Child-Pugh B subgroups; ∗∗∗∗ p = 0.001, Child-Pugh A subgroup versus Child-Pugh C patients. For (b): p = 0.001, control group versus ALC group; ∗∗ p = 0.001, control group versus Child-Pugh A subgroup; ∗∗∗ p = 0.001, Child-Pugh A versus Child-Pugh B subgroups; ∗∗∗∗ p = 0.001, Child-Pugh A subgroup versus Child-Pugh C patients.
Figure 5
Figure 5
GSH/GSSG ratio determination. The GSH/GSSG ratio was determined in total blood from participants of the control group (control) and patients with alcoholic liver cirrhosis (ALC), classified according to the Child-Pugh score as Child-Pugh A, Child-Pugh B, or Child-Pugh C. (a) Patients without current alcohol consumption; (b) patients with active alcohol consumption. Each bar represents the mean value of experiments performed ± SEM. For (a): p = 0.004, control group versus Child-Pugh B patients; ∗∗ p = 0.001, Child-Pugh A versus Child-Pugh B subgroups; ∗∗∗ p = 0.034, Child-Pugh A subgroup versus Child-Pugh C patients.

References

    1. Room R., Babor T., Rehm J. Alcohol and public health. The Lancet. 2005;365(9458):519–530. doi: 10.1016/s0140-6736(05)17870-2. - DOI - PubMed
    1. Frid A. Moderate alcohol drinking protects against heart disease. Lakartidningen. 2000;97(9):946–947. - PubMed
    1. Michael Gaziano J., Gaziano T. A., Glynn R. J., et al. Light-to-moderate alcohol consumption and mortality in the physicians' health study enrollment cohort. Journal of the American College of Cardiology. 2000;35(1):96–105. doi: 10.1016/S0735-1097(99)00531-8. - DOI - PubMed
    1. Elkind M. S. V., Sciacca R., Boden-Albala B., Rundek T., Paik M. C., Sacco R. L. Moderate alcohol consumption reduces risk of ischemic stroke: The Northern Manhattan Study. Stroke. 2006;37(1):13–19. doi: 10.1161/01.str.0000195048.86810.5b. - DOI - PubMed
    1. Galicia-Moreno M., Gutiérrez-Reyes G. The role of oxidative stress in the development of alcoholic liver disease. Revista de Gastroenterologia de Mexico. 2014;79(2):135–144. doi: 10.1016/j.rgmx.2014.03.001. - DOI - PubMed