. 2017 Dec;78(6):2136-2148.
doi: 10.1002/mrm.26577. Epub 2017 Jan 11.

Imaging and T2 relaxometry of short-T2 connective tissues in the knee using ultrashort echo-time double-echo steady-state (UTEDESS)

Affiliations

Imaging and T2 relaxometry of short-T2 connective tissues in the knee using ultrashort echo-time double-echo steady-state (UTEDESS)

Akshay S Chaudhari et al. Magn Reson Med. 2017 Dec.

Abstract

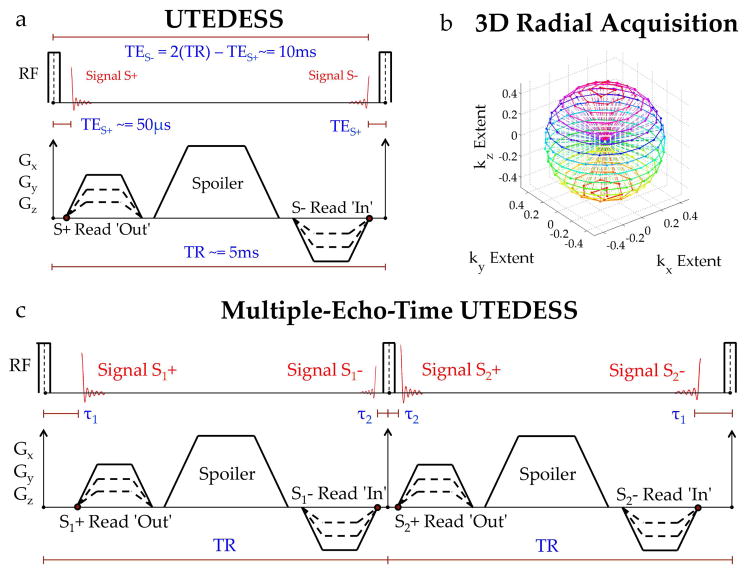
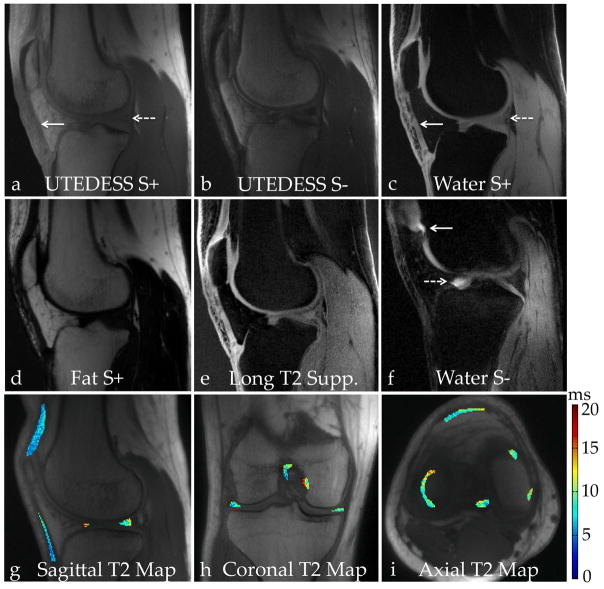
Purpose: To develop a radial, double-echo steady-state (DESS) sequence with ultra-short echo-time (UTE) capabilities for T2 measurement of short-T2 tissues along with simultaneous rapid, signal-to-noise ratio (SNR)-efficient, and high-isotropic-resolution morphological knee imaging.

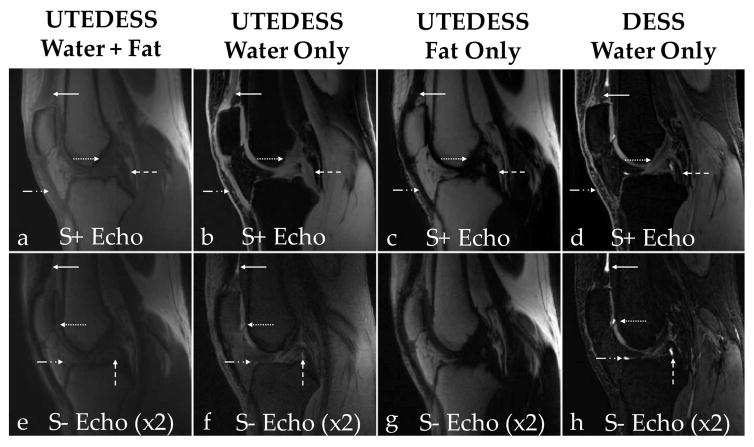
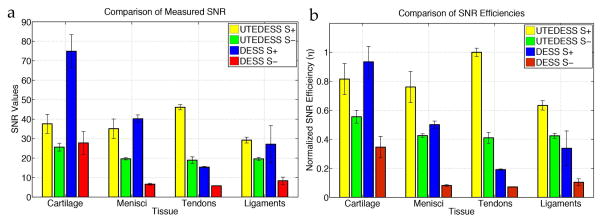
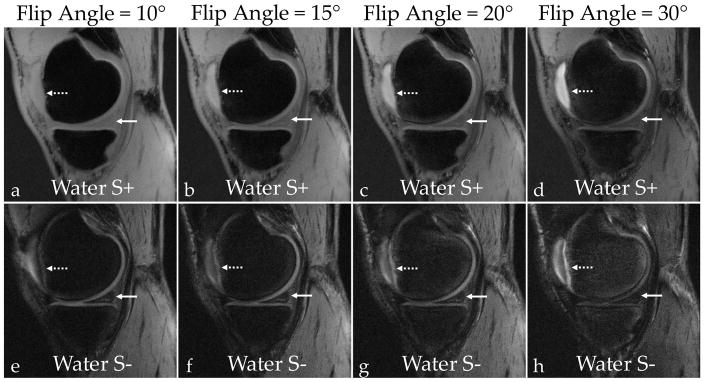
Methods: THe 3D radial UTE readouts were incorporated into DESS, termed UTEDESS. Multiple-echo-time UTEDESS was used for performing T2 relaxometry for short-T2 tendons, ligaments, and menisci; and for Dixon water-fat imaging. In vivo T2 estimate repeatability and SNR efficiency for UTEDESS and Cartesian DESS were compared. The impact of coil combination methods on short-T2 measurements was evaluated by means of simulations. UTEDESS T2 measurements were compared with T2 measurements from Cartesian DESS, multi-echo spin-echo (MESE), and fast spin-echo (FSE).

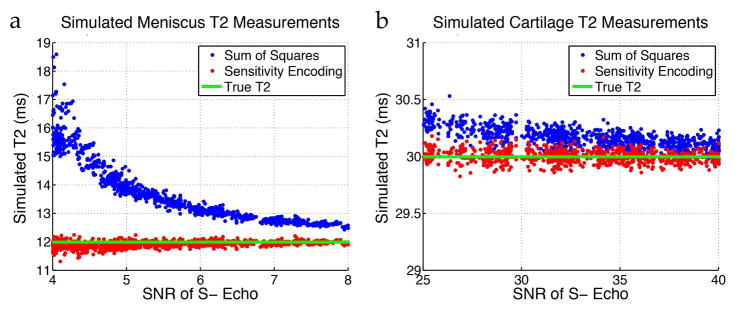
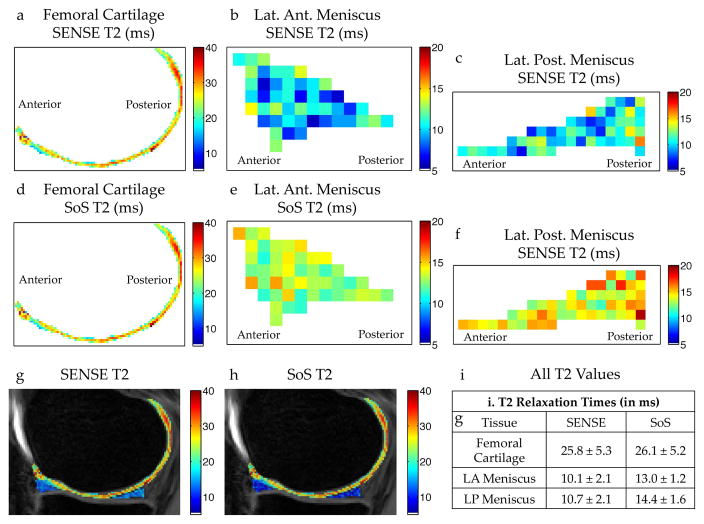
Results: UTEDESS produced isotropic resolution images with high SNR efficiency in all short-T2 tissues. Simulations and experiments demonstrated that sum-of-squares coil combinations overestimated short-T2 measurements. UTEDESS measurements of meniscal T2 were comparable to DESS, MESE, and FSE measurements while the tendon and ligament measurements were less biased than those from Cartesian DESS. Average UTEDESS T2 repeatability variation was under 10% in all tissues.

Conclusion: The T2 measurements of short-T2 tissues and high-resolution morphological imaging provided by UTEDESS makes it promising for studying the whole knee, both in routine clinical examinations and longitudinal studies. Magn Reson Med 78:2136-2148, 2017. © 2017 International Society for Magnetic Resonance in Medicine.

Keywords: double-echo steady-state (DESS); isotropic resolution; osteoarthritis; relaxometry; short-T2; ultrashort echo time (UTE).


Figures

Figure 1
Figure 1
(a) Illustration of the Ultrashort Echo-Time Double-Echo Steady-State (UTEDESS) pulse sequence. The S+ echo samples the free induction decay caused by the hard RF excitation. The S− echo samples the S+ signal from prior TRs that was dephased and then later rephased. (b) The 3D radial sampling strategy for UTEDESS where the dotted lines represent the trajectory of the radial spokes. The S+ echo is sampled radially outward – from the center of k-space to the radial endpoints (dots on the k-space sphere) while the S− echo is sampled radially inward – from the endpoints to the center of the k-space. (c) A multiple-echo-time version of UTEDESS has gradients in successive TRs shifted by a finite duration while maintaining a constant TR and symmetry across the second RF excitation. This creates a pair of S+ and S− images each with different TEs that can be used for Dixon water-fat separation. The time between S2− and the subsequent RF pulse can be used for necessary sequence updates, so the Dixon scheme comes at a cost of little sequence dead time.
Figure 2
Figure 2
Sensitivity of the UTEDESS T2 measurements in tissues with approximate T2 of tendons (5ms), menisci (12ms), and cartilage (35ms), to parameters of diffusivity, T1, and B1. Reference T2 values were calculated with all diffusivities = 1.25×10⁻⁹m2s−1, all flip angles = 10°, tendon T1 = 1151ms, meniscus T1 = 998ms, and cartilage T1 = 1167ms as described below. Simulated T2 values were calculated with varying diffusivity, T1, and B1 values, and the error between the reference and simulated values was measured. (a) The sensitivity profile shows minimal sensitivity to ADC, partly because a very low diffusion weighting was applied in the sequence. (b) The short-T2 tissues show low sensitivity to T1, where ~40% underestimations in T1 only lead to ~6% variations in T2. However, the sensitivity increases as the T2 of the tissues increases. (c) T2 measurements show the highest sensitivity to B1, though the sensitivity decreases significantly with increasing flip angles.
Figure 3
Figure 3
Monte-Carlo simulations with spatially varying coil sensitivities and varying levels of complex Gaussian noise were performed while using R=1 SENSE and SoS for coil combination and generating T2 maps. (a) For low SNR values typically seen with meniscus (T2 about 12ms), SoS significantly overestimates the estimated T2. (b) For higher SNR typically seen with cartilage (T2 about 30ms), SENSE and SoS have comparable T2 estimates.
Figure 4
Figure 4
In vivo T2 differences between R=1 SENSE and SoS coil combinations with DESS. T2 measurements in the femoral cartilage (a), lateral anterior (LA) meniscal horn (b), and in the lateral posterior (LP) meniscal horn (c) generated with a SENSE coil combination show consistently lower T2 values in the meniscus compared to a SoS combination for the same regions of interest (d–f). (g–i) Unlike the T2 in the meniscus, the T2 measurements in cartilage are similar for both coil combination methods.
Figure 5
Figure 5
Images from selected volunteers showing the contrasts that can be generated with UTEDESS. (a) The S+ UTE images are T1-weighted and have high signal intensity from short-T2 tissues such as the tendons (solid arrow) and the menisci (dashed arrow). (b) The S− echo is more highly T2 weighted where the short-T2 tissues have lower signal. (c) The water-fat separation method provides spectral separation with two echo times. There is clear separation of the short-T2 tissues of the tendons (solid arrow) and the meniscus (dashed arrow) since the longest echo time used is only 1.1ms. (d) Implementing a Dixon-based water-fat separation, as opposed to using a fat-saturation RF pulse, generates a fat-only image. (e) Performing a weighted subtraction of the water S− image from the water S+ image helps suppress the longer-T2 signals. This provides a similar contrast to the high SNR water S+ image but the weightings can be modified based on the short-T2 anatomy that needs to be visualized. (f) In a different subject with fluid in the knee, the water S− image highlights the bright signal around the patellar cartilage (solid arrow) and the anterior horn of the lateral meniscus (dashed arrow). The water S− image has a T2 weighting and has a lower dynamic range relative to the non-water-fat separated S− image. (g–i) Due to the isotropic resolution of the sequence, the scan planes can be formatted in arbitrary directions to create and view T2 maps.
Figure 6
Figure 6
Comparison of images generated with UTEDESS and DESS. Column 1 shows UTEDESS images, columns 2 and 3 show the UTEDESS retrospective water and fat decomposed images respectively, and column 4 shows the DESS water only acquisition. (a–d) In the S+ images, the quadriceps tendons (solid arrow), patellar tendon (dash-dot arrow), the anterior cruciate ligament (dotted arrow), and the posterior cruciate ligament (dashed arrow) show excellent signal with minimal blurring in the UTEDESS images. There is minimal signal in these tissues with DESS. (e–h) In the S− echoes for both sequences, there is bright fluid signal present posterior to the quadriceps tendon (dashed arrow), in the inferior section of the patellar cartilage (dotted arrow), around the tibial cartilage (dash dot arrow), and the anterior section of the posterior cruciate ligament (dashed arrow). This bright fluid signal can be better visualized with DESS.
Figure 7
Figure 7
Comparison of signal-to-noise ratios (SNR) and SNR efficiencies (η) normalized to the scan time and voxel volume. The SNR values (a) show that UTEDESS outperforms DESS in all short-T2 tissues, except in the S+ echo for meniscus. The S− SNR, however, is higher for all short-T2 tissues with UTEDESS. This higher SNR makes accurate T2 fitting possible. (b) The higher SNR efficiencies with UTEDESS show that when normalized for the resolution and scan time, UTEDESS provides a higher SNR in all short-T2 tissues per unit time, compared to DESS, while maintaining a comparable SNR efficiency in the longer-T2 tissues such as cartilage.
Figure 8
Figure 8
SNR was measured in the patellar cartilage, the medial meniscus, the patellar tendon, the posterior cruciate ligament, the gastrocnemius muscle, femoral bone marrow (“Fat”), and synovial fluid. (a–d) Increasing the flip angle results in lower signal in the meniscus (solid arrows) in the water S+ images. (e–h) While decreasing overall signal from soft-tissues, higher flip angles also increase cartilage-fluid contrast (dotted arrows) in the water S− images. The increasing flip angle also results in better contrast between the synovial fluid and membrane. (i) By comparing the normalized SNR as a function of flip angle, the SNR for all soft-tissues decreases with an increasing flip angle while the fat and fluid SNR stays relatively constant. (j) An increasing flip-angle increases the cartilage-fluid CNR due to constant fluid signal and attenuated cartilage signals. At a flip of angle of 30°, there is considerably lower meniscal and muscle signal, which reduces the CNR between those tissues and cartilage.

Similar articles

Cited by

References

    1. Reicher MA, Bassett LW, Gold RH. High-resolution magnetic resonance imaging of the knee joint: pathologic correlations. AJR American journal of roentgenology. 1985;145(5):903–909. - PubMed
    1. Mosher TJ. Musculoskeletal imaging at 3T: current techniques and future applications. Magnetic resonance imaging clinics of North America. 2006;14(1):63–76. - PubMed
    1. Robson MD, Gatehouse PD, Bydder M, Bydder GM. Magnetic resonance: an introduction to ultrashort TE (UTE) imaging. Journal of computer assisted tomography. 2003;27(6):825–846. - PubMed
    1. Qian Y, Williams AA, Chu CR, Boada FE. Multicomponent T2* mapping of knee cartilage: technical feasibility ex vivo. Magnetic resonance in medicine. 2010;64(5):1426–1431. - PMC - PubMed
    1. Du J, Diaz E, Carl M, Bae W, Chung CB, Bydder GM. Ultrashort echo time imaging with bicomponent analysis. Magnetic resonance in medicine. 2012;67(3):645–649. - PubMed