. 2017 Jan 11:7:40370.
doi: 10.1038/srep40370.

Antiproliferative Effects of 1α-OH-vitD3 in Malignant Melanoma: Potential Therapeutic implications

Affiliations

Antiproliferative Effects of 1α-OH-vitD3 in Malignant Melanoma: Potential Therapeutic implications

Lucia Spath et al. Sci Rep. .

Abstract

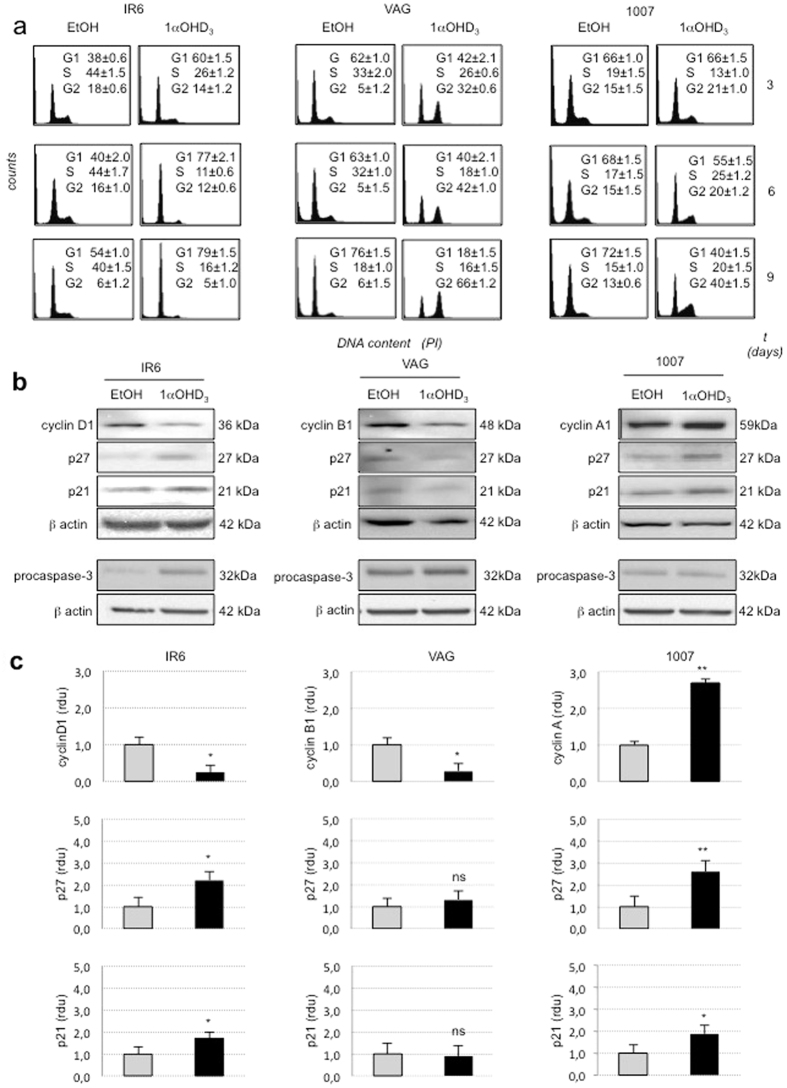
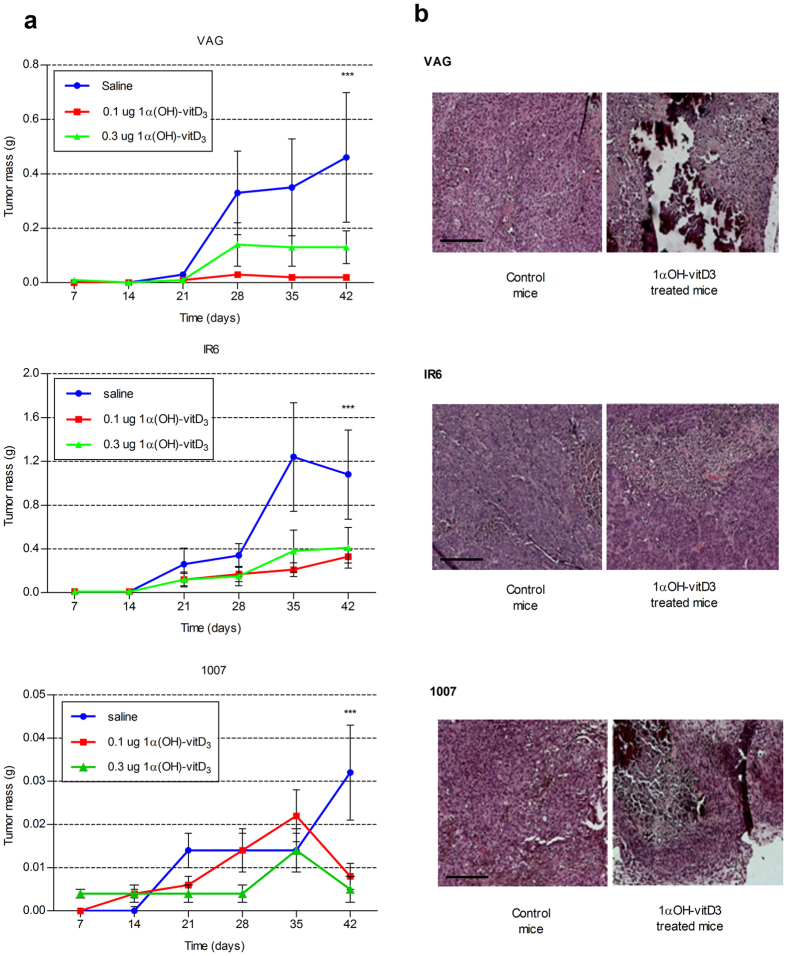
Early detection and surgery represent the mainstay of treatment for superficial melanoma, but for high risk lesions (Breslow's thickness >0.75 mm) an effective adjuvant therapy is lacking. Vitamin D insufficiency plays a relevant role in cancer biology. The biological effects of 1α hydroxycholecalciferol on experimental melanoma models were investigated. 105 melanoma patients were checked for 25-hydroxycholecalciferol (circulating vitamin D) serum levels. Human derived melanoma cell lines and in vivo xenografts were used for studying 1α-hydroxycholecalciferol-mediated biological effects on cell proliferation and tumor growth. 99 out of 105 (94%) melanoma patients had insufficient 25-hydroxycholecalciferol serum levels. Interestingly among the six with vitamin D in the normal range, five had a diagnosis of in situ/microinvasive melanoma. Treatment with 1α-hydroxycholecalciferol induced antiproliferative effects on melanoma cells in vitro and in vivo, modulating the expression of cell cycle key regulatory molecules. Cell cycle arrest in G1 or G2 phase was invariably observed in vitamin D treated melanoma cells. The antiproliferative activity induced by 1α-hydroxycholecalciferol in experimental melanoma models, together with the discovery of insufficient 25-hydroxycholecalciferol serum levels in melanoma patients, provide the rationale for using vitamin D in melanoma adjuvant therapy, alone or in association with other therapeutic options.


Figures

Figure 1
Figure 1. Insufficient 25-OH-vitD serum level is a common feature in melanoma patients.
(a) Comparative evaluation of 25-OH-vitD serum levels registered in 105 melanoma patients at time of surgery (formula image
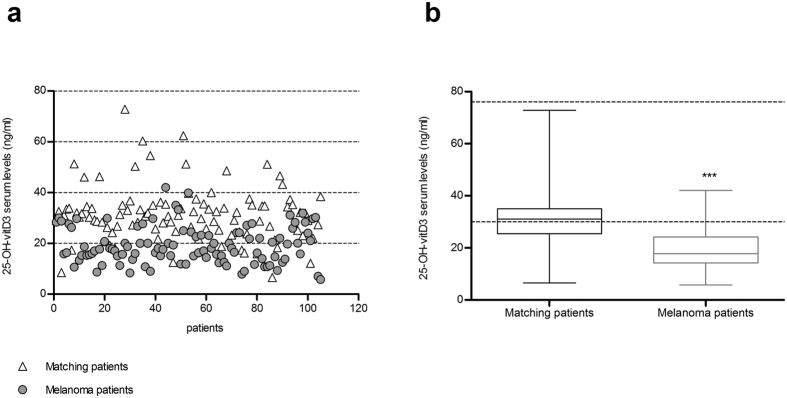
) and in 101 matched (for sex and age) healthy individuals (∆). (b) The area between 30–76 ng/mL, which represents 25-OH-vitD sufficiency, is marked by a gray line. Standard deviation is shown (Statistical analysis using t-test: ***p value < 0.005).
Figure 2
Figure 2. Antiproliferative effects of 1α-hydroxycholecalciferol and vitamin-D2 synthetic derivative paricalcitol on melanoma cells in vitro.
Melanoma cells proliferation as determined by colorimetric tetrazolium salt assay (MTS assay) in the presence of (a) 20 ng/mL (5 × 108 M) 1α-hydroxycholecalciferol (two different pharmaceutical preparations) and (b) vitamin-D2 active derivative paricalcitol at concentration ranging from 80 ng/mL to 800 ng/mL. Six metastatic melanoma cell lines were used in this experiment. The assay was performed after 72 hours of vitamin-D treatment. Untreated cells (CTR) and cells incubated with ethanol (EtOH 0.1%) were used as controls. (Experiments in triplicate. S.D. is reported on the top of each column. Statistical analysis using ANOVA and Bonferroni post-hoc test: ns = not significant; *p < 0.05; **p < 0.01; ***p < 0.001).
Figure 3
Figure 3. Effects of long-term incubation with 1α-hydroxycholecalciferol on tumorigenic melanoma cell lines.
(a) Melanoma cell proliferation analyzed by cell counting after 3, 6 and 9 days of 1α-OH-D3 treatment, is strongly inhibited in the presence of vitamin-D3. This effect was not observed in melanoma control cells growing in standard vitD3 –free medium (solvent alone). (b) Proliferation assay was performed after 1α-OH-vitD3 withdrawal at 6 and 9 days. As showed in the right panel, cell proliferation was rescued up to 6 days of treatment. For longer vitD3 treatment (>9 days) all the melanoma cells failed to be recovered. (Experiments in triplicate. Mean ± S.D. is reported. Statistical analysis using ANOVA and Bonferroni post-hoc test: **p < 0.01; ***p < 0.001).: ** p < 0.01; ***p < 0.001.
Figure 4
Figure 4. 1α-hydroxycholecalciferol–mediated effects on cell morphology and differentiation.
(a) Morphological aspects of melanoma cell differentiation observed after 18 days of vitamin-D3 treatment. Melanoma cells cultured in conventional vitamin-D3 free medium (CRT) and medium supplemented with solvent alone (0.1% ethanol) were used as comparative controls. Note single scattered IR6, VAG and 1007 melanoma cells with enlarged cytoplasm and small dendritic processes after 18 days of vitamin-D3 treatment (scale bar = 100 μm). (b) E-cadherin increased expression in vitamin-D3 treated cells, as evaluated in western blot analysis by using a specific mAb; The slight differences in MW of the observed bands are likely due to the expression of cell-specific isoforms of the protein. β-actin was used as loading control (figure derived from cropped gel/blot for semplification). (C) E-chaderin expression at immunohistochemical level on vitamin-D3 treated and untreated representative melanoma xenografts (post-autopsy) (indirect immunoperoxidase; scale bar = 200 μm).
Figure 5
Figure 5. Cell cycle analysis of tumorigenic melanoma cell lines with and without vitamin-D3 exposure.
(a) Fluorescence-activated cell sorting (FACS) of IR6, VAG and 1007 cell lines treated for 3, 6, and 9 days with (1α-OH-vitD3) or without (CTR) 1α-OH-vitD3 20 ng/ml (5 × 10−8 M), Cell cycle perturbation and redistribution of IR6, VAG and 1007 melanoma cells in presence of vitamin-D3 is demonstrated. Row data regarding cell distribution (%) in G1, S, and G2 phases are shown in detail. (b) Western blot analysis to support FACS data, showing modulation of cell-cycle key regulatory molecules expected to be specifically involved in G1 and G2 blocks, performed on total cell lysates from IR6, VAG and 1007 melanoma cells after 72 h of vitamin-D3 treatment. In the bottom of panel B the lack of procaspase-3 cleavage is shown to demonstrate the absence of apoptosis in vitamin-D3 treated cells. (All the experiments were performed in triplicate; figure derived from a cropped gels/blots for semplification) (c) Densitometric analysis of cyclins (D1, A,B), p27 and p21 protein bands shown in panel B. Each band intensity was first normalized to the corresponding band of internal control (β-actin). Bands obtained from vitamin-D treated and untreated cells were compared each other, normalizing those derived from untreated cells to 1. The band intensity is represented in the graph as relative densitometric unit (rdu). Data are means ± SD of the relative band intensity from three independent WB experiments. Standard deviation is shown (Statistical analysis using t-test: ns = not significant; *p < 0.05; **p < 0.01).
Figure 6
Figure 6. Effects of long-term systemic administration of 1α-hydroxycholecalciferol on melanoma growth in vivo.
(a) Tumor mass variations at the end of vitamin-D3 treatment in vivo (day 42 from melanoma cells injection). Each point represents the average of values of four xenografted melanomas. Values at day 42 were directly determined at autopsy. (S.D. is reported on the top of each point. Statistical analysis at 42 days using ANOVA and Bonferroni post-hoc test: saline vs treated mice ***p < 0.001). (b) Representative panel of histological slides showing tumor necrosis and dystrophic calcifications in the vitamin-D3 treated residual melanoma xenografts collected at autopsy. Melanoma xenografts from animals injected with saline solution alone, were used as comparative controls. (Formalin-fixed and paraffin embedded histological preparations; haematoxylin-eosin staining; scale bar = 200μm).

Similar articles

Cited by

References

    1. Siegel R., Naishadham D. & Jemal A. Cancer statistics, 2012. CA. Cancer J. Clin. 62, 10–29 (2012). - PubMed
    1. Tsao H., Atkins M. B. & Sober A. J. Management of cutaneous melanoma. N Engl J Med 351, 998–1012 (2004). - PubMed
    1. Cummins D. L. et al.. Cutaneous malignant melanoma. Mayo Clin. Proc. 81, 500–507 (2006). - PubMed
    1. Korn E. L. et al.. Meta-analysis of phase II cooperative group trials in metastatic stage IV melanoma to determine progression-free and overall survival benchmarks for future phase II trials. J. Clin. Oncol. 26, 527–534 (2008). - PubMed
    1. Kudchadkar R. & Sondak V. Adjuvant interferon: recommit or move on? Lancet Oncol. 12, 112–113 (2011). - PubMed

Publication types

MeSH terms