. 2017 Jan 11:7:40515.
doi: 10.1038/srep40515.

The Helicobacter cinaedi antigen CAIP participates in atherosclerotic inflammation by promoting the differentiation of macrophages in foam cells

Affiliations

The Helicobacter cinaedi antigen CAIP participates in atherosclerotic inflammation by promoting the differentiation of macrophages in foam cells

Mario Milco D'Elios et al. Sci Rep. .

Abstract

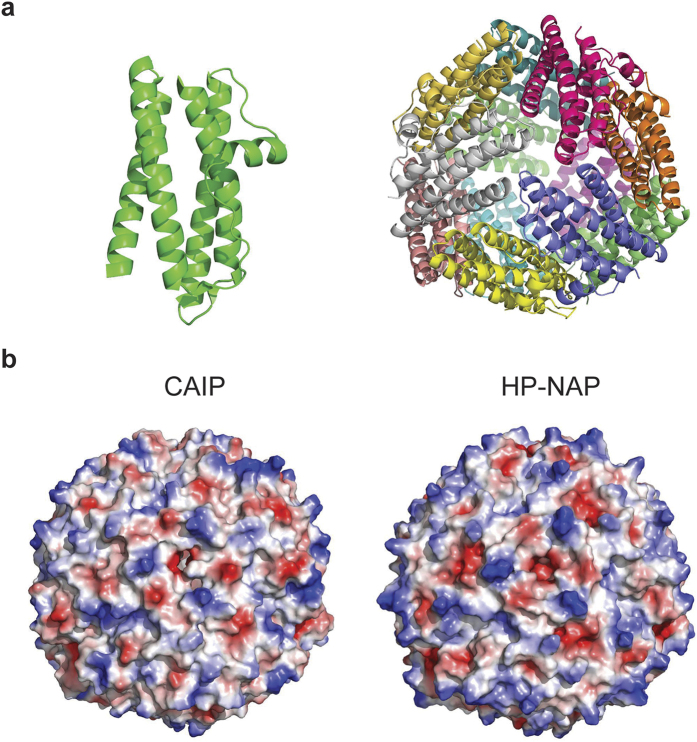
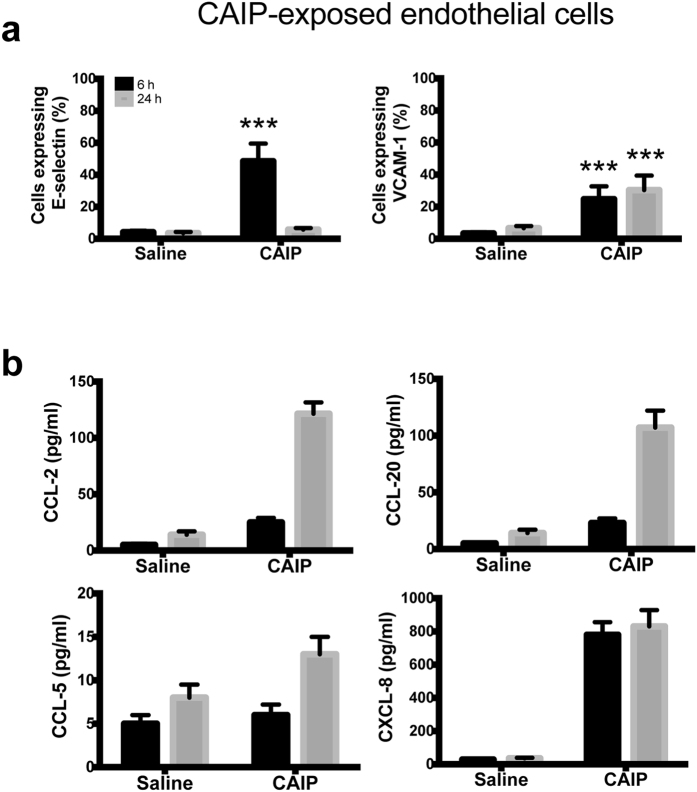
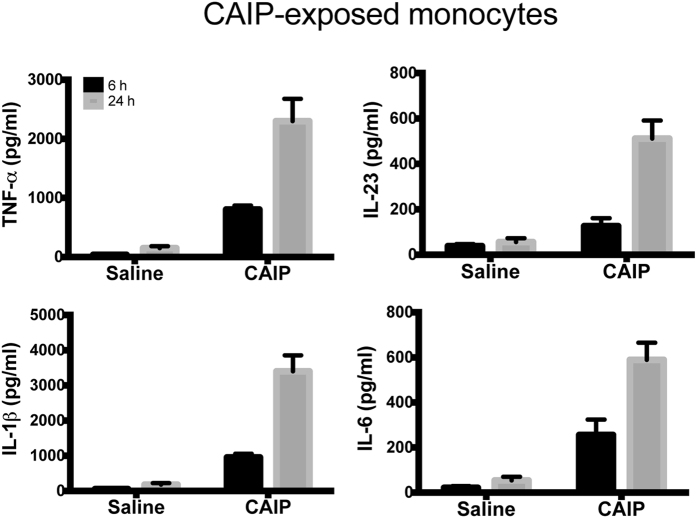
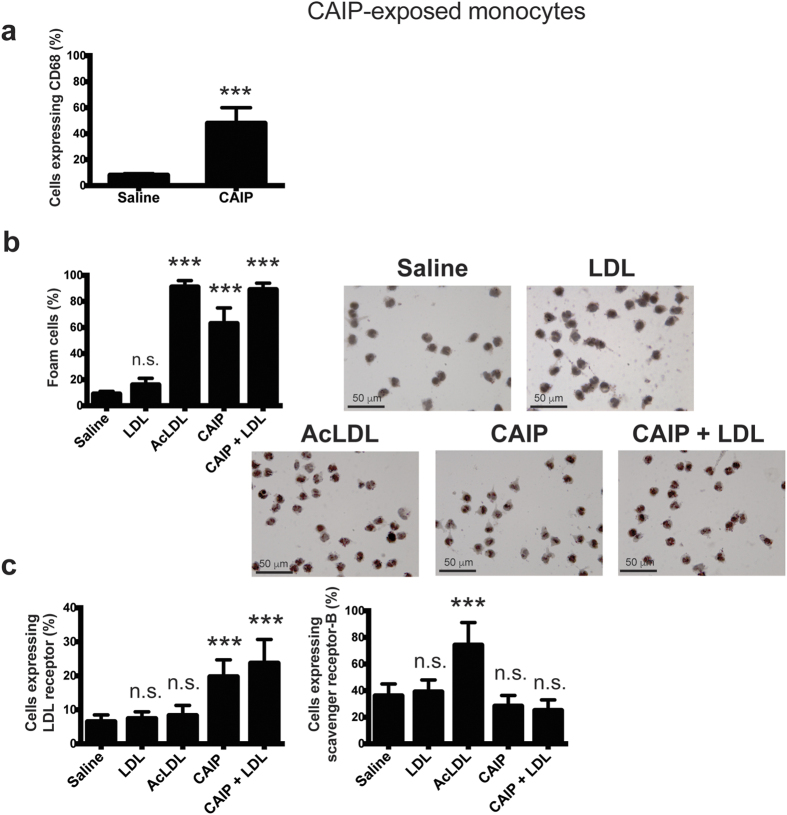
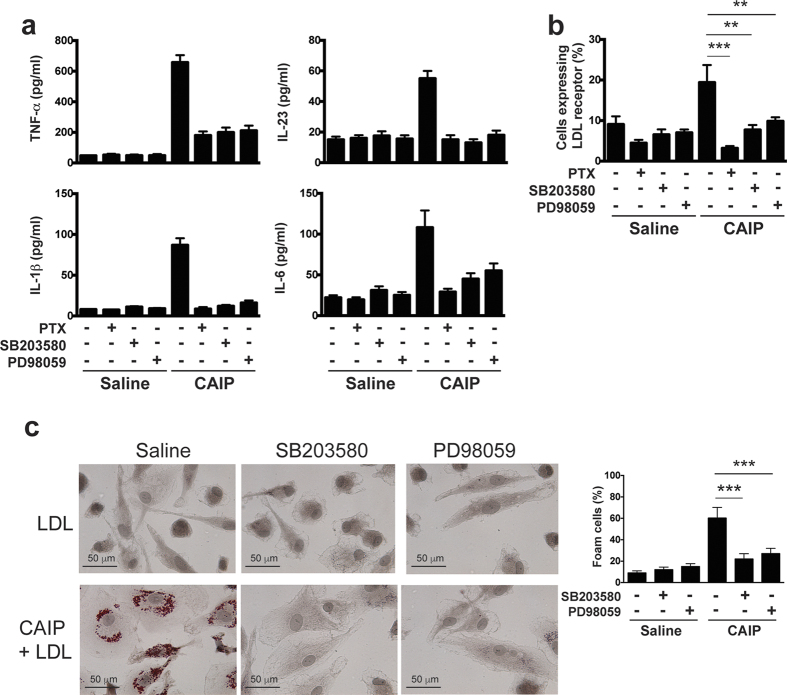
Recent studies have shown that certain specific microbial infections participate in atherosclerosis by inducing inflammation and immune reactions, but how the pathogens implicated in this pathology trigger the host responses remains unknown. In this study we show that Helicobacter cinaedi (Hc) is a human pathogen linked to atherosclerosis development since at least 27% of sera from atherosclerotic patients specifically recognize a protein of the Hc proteome, that we named Cinaedi Atherosclerosis Inflammatory Protein (CAIP) (n = 71). CAIP appears to be implicated in this pathology because atheromatous plaques isolated from atherosclerotic patients are enriched in CAIP-specific T cells (10%) which, in turn, we show to drive a Th1 inflammation, an immunopathological response typically associated to atherosclerosis. Recombinant CAIP promotes the differentiation and maintenance of the pro-inflammatory profile of human macrophages and triggers the formation of foam cells, which are a hallmark of atherosclerosis. This study identifies CAIP as a relevant factor in atherosclerosis inflammation linked to Hc infection and suggests that preventing and eradicating Hc infection could reduce the incidence of atherosclerosis.


Figures

Figure 1
Figure 1. Atherosclerotic patients have both antibodies in the serum and Th1 cells in the plaques that are specific for CAIP.
(a) Seroconversion against CAIP of 38 healthy subjects and 71 subjects with atherosclerosis is shown. Individuals positive for H. pylori infection (Hp+) are distinguished from those that are H. pylori-negative (Hp−). ELISA results were considered positive at >5 S.D. above the mean value in healthy subjects, and 0.5 absorbance units (A.U.) was considered the threshold (dotted horizontal line). (b) The immune profile of CAIP-specific T helper cells, isolated from the human atherosclerotic plaques, is shown. Carotid plaques were obtained by endoarterectomy from 8 CAIP-seropositive patients with atherosclerotic arteriopathy. CAIP-specific T cell clones derived from human atherosclerotic lesions were stimulated with or without CAIP, in presence of autologous antigen-presenting cells. IFN-γ, IL-4, IL-17 production was measured in culture supernatants. CD4+ clones able to produce IFN-γ, but not IL-4, were classified as Thl; CD4+ clones producing both IFN-γ and IL-17 were classified as Th1/Th17; CD4+ clones producing both IFN-γ and IL-4 were classified as Th0. In absence of CAIP stimulation the levels of IFN-γ, IL-4, IL-17 were consistently <7 pg/ml.
Figure 2
Figure 2. CAIP crystal structure.
(a) Cartoon view of CAIP monomer (left) and dodecamer (right). Each subunit is shown in a different color. One of the three-fold molecular axes is in the center of the structure, perpendicular to the plane of the paper. (b) Qualitative surface electrostatic potential of CAIP (left) and HP-NAP (right). Positive charges are in blue, negative in red. A different charge distribution on the surface of the two proteins is evident.
Figure 3
Figure 3. CAIP promotes the activation of macrophages and their polarization towards the M1 phenotype.
Monocytes were differentiated for 6 d into M1 or into M2 macrophages and subsequently treated for 24 h with saline, IL-4 + M-CSF, LPS + IFN-γ or CAIP. (a) TNF-α, IL-23, IL-1β and IL-6 protein content in the culture supernatants. Data are expressed as mean value ± S.D. of 3 independent experiments performed with 3 different cell preparations. (b) Expression of CD86, CD163 and CD206 analysed by flow cytometry. Data are shown as Mean Fluorescence Intensity (MFI) ± S.D. of 3 independent experiments performed with 3 different cell preparations. Significance was determined by Student’s t-test versus saline-exposed cells. **p < 0.01; ***p < 0.001. (c) Levels of CCL-2, CCL-20 and CCL-5 in the culture supernatants quantified by specific ELISA assays. Data are expressed as mean value ± S.D. of 3 independent experiments performed with 3 different cell preparations.
Figure 4
Figure 4. CAIP induces foam cell formation.
(a) Macrophages treated 24 h with saline, LDL, AcLDL, CAIP or CAIP + LDL were stained with Oil Red O. Images are representative of one of 3 independent experiments performed with 3 different cell preparations. The number of foam cells was determined and expressed as percentage of total cells counted in 10 random fields. Data are expressed as mean value ± S.D. of 3 independent experiments performed with 3 different cell preparations. Significance was determined by Student’s t-test versus saline-exposed cells. ***p < 0.001. (b) Cells were analysed for the surface expression of LDL receptor and scavenger receptor-B by flow cytometry, after a 24-h treatment. Data are shown as mean percentage of positive cells ± S.D. of 3 independent experiments performed with 3 different cell preparations. Significance was determined by Student’s t-test versus saline-exposed cells. ***p < 0.001.
Figure 5
Figure 5. CAIP induces expression of adhesion molecules and chemokines in endothelial cells.
Endothelial cells exposed to saline or CAIP for 6 and 24 h. (a) Surface expression of E-selectin and VCAM-1, as determined by flow cytometry. Data are expressed as mean percentage of positive cells ± S.D. of 3 independent experiments performed with 3 different cell preparations. Significance was determined by Student’s t-test versus saline-exposed cells at each time point. ***p < 0.001. (b) Levels of CCL-2, CCL-20, CCL-5 and CXCL-8 accumulated in the culture supernatants quantified by specific ELISA assays. Data are expressed as mean ± S.D. of 3 independent experiments performed with 3 different cell preparations.
Figure 6
Figure 6. CAIP induces TNF-α, IL-23, IL-1β and IL-6 production in monocytes.
Cells were exposed to saline or CAIP for 6 and 24 h. Culture supernatants were collected and the cytokine content was determined by ELISA. Data are expressed as mean value ± S.D. of 3 independent experiments performed with 3 different cell preparations.
Figure 7
Figure 7. CAIP promotes the differentiation of monocytes into macrophage-derived foam cells.
(a) Expression of CD68 on monocytes exposed to saline or CAIP for 24 h. Data are shown as mean percentage of positive cells ± S.D. of three independent experiments from three different donors. Significance was determined by Student’s t-test versus saline-exposed cells. ***p < 0.001. (b) Monocytes treated 24 h with saline, LDL, AcLDL, CAIP or CAIP + LDL were stained with Oil Red O. Images are representative of one of 3 independent experiments performed with 3 different cell preparations. The number of foam cells was determined and expressed as percentage of total cells counted in 10 random fields. Data are expressed as mean value ± S.D. of 3 independent experiments performed with 3 different cell preparations. Significance was determined by Student’s t-test versus saline-exposed cells. ***p < 0.001. (c) Cells were analysed for the surface expression of LDL receptor and scavenger receptor-B by flow cytometry, after a 24-h treatment. Data are shown as mean percentage of positive cells ± S.D. of 3 independent experiments performed with 3 different cell preparations. Significance was determined by Student’s t-test versus saline-exposed cells. ***p < 0.001.
Figure 8
Figure 8. CAIP activates a Gi protein-coupled receptor in macrophages.
Macrophages were either untreated or pre-incubated 16 h with PTX or 30 min with SB203580 or PD98059 and then treated with saline or CAIP for 24 h. (a) TNF-α, IL-23, IL-1β and IL-6 protein content in the culture supernatants. Data are expressed as mean value ± S.D. of 2 independent experiments performed with 2 different cell preparations. (b) Cells were analysed for the surface expression of LDL receptor by flow cytometry. Data are shown as mean percentage of positive cells ± S.D. of 2 independent experiments performed with 2 different cell preparations. Significance was determined by Student’s t-test. **p < 0.01 and ***p < 0.001. (c) Macrophages were stained with Oil Red O. Images are representative of one of 2 independent experiments performed with 2 different cell preparations. The number of foam cells was determined and expressed as percentage of total cells counted in 10 random fields. Data are expressed as mean value ± S.D. of 2 independent experiments performed with 2 different cell preparations. Significance was determined by Student’s t-test. ***p < 0.001.

References

    1. Mozaffarian D. et al.. Heart disease and stroke statistics–2015 update: a report from the American Heart Association. Circulation 131, e29–322 (2015). - PubMed
    1. Hansson G. K. & Hermansson A. The immune system in atherosclerosis. Nat. Immunol. 12, 204–212 (2011). - PubMed
    1. Shashkin P., Dragulev B. & Ley K. Macrophage differentiation to foam cells. Curr. Pharm. Des. 11, 3061–3072 (2005). - PubMed
    1. Hansson G. K., Robertson A.-K. L. & Söderberg-Nauclér C. Inflammation and atherosclerosis. Annu Rev Pathol 1, 297–329 (2006). - PubMed
    1. O’Connor S., Taylor C., Campbell L. A., Epstein S. & Libby P. Potential infectious etiologies of atherosclerosis: a multifactorial perspective. Emerging Infect. Dis. 7, 780–788 (2001). - PMC - PubMed

Publication types

MeSH terms