

Transgender Population Size in the United States: a Meta-Regression of Population-Based Probability Samples
- PMID: 28075632
- PMCID: PMC5227946
- DOI: 10.2105/AJPH.2016.303578
Transgender Population Size in the United States: a Meta-Regression of Population-Based Probability Samples
Abstract
Background: Transgender individuals have a gender identity that differs from the sex they were assigned at birth. The population size of transgender individuals in the United States is not well-known, in part because official records, including the US Census, do not include data on gender identity. Population surveys today more often collect transgender-inclusive gender-identity data, and secular trends in culture and the media have created a somewhat more favorable environment for transgender people.
Objectives: To estimate the current population size of transgender individuals in the United States and evaluate any trend over time.
Search methods: In June and July 2016, we searched PubMed, Cumulative Index to Nursing and Allied Health Literature, and Web of Science for national surveys, as well as "gray" literature, through an Internet search. We limited the search to 2006 through 2016.
Selection criteria: We selected population-based surveys that used probability sampling and included self-reported transgender-identity data.
Data collection and analysis: We used random-effects meta-analysis to pool eligible surveys and used meta-regression to address our hypothesis that the transgender population size estimate would increase over time. We used subsample and leave-one-out analysis to assess for bias.
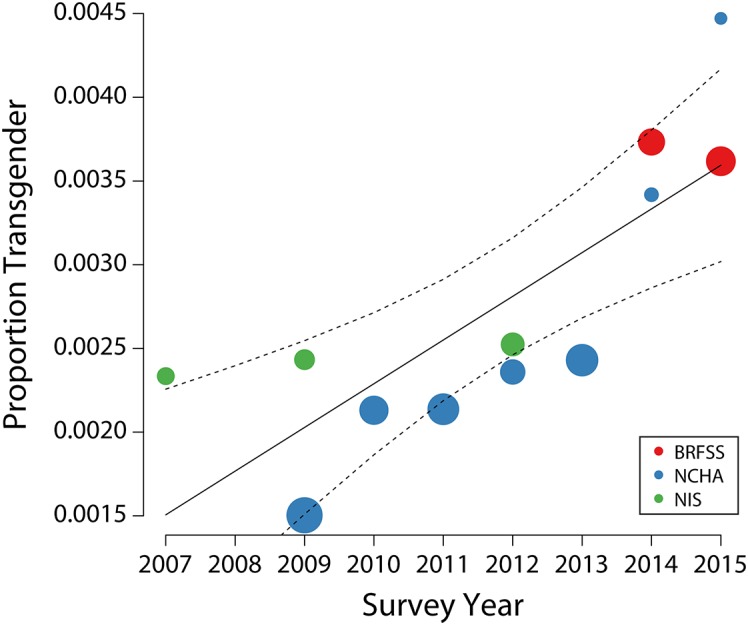
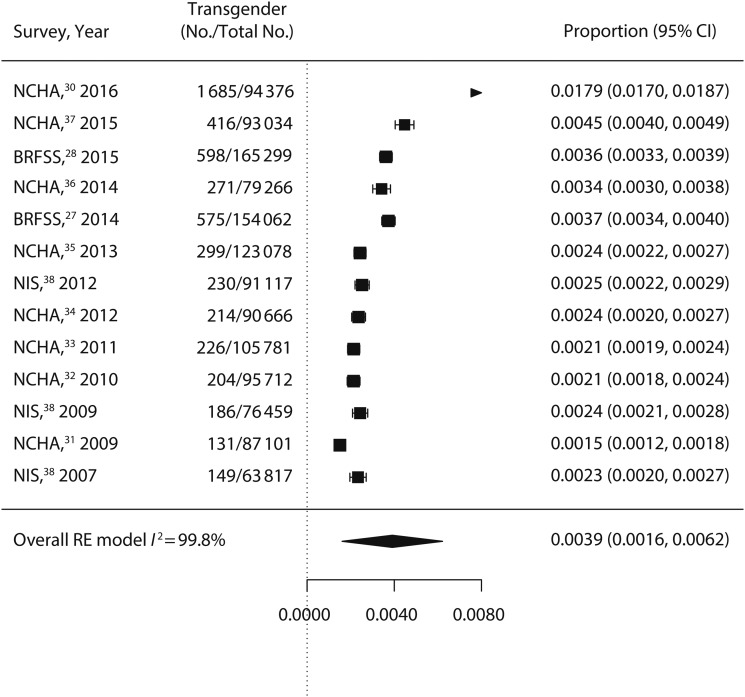
Main results: Our meta-regression model, based on 12 surveys covering 2007 to 2015, explained 62.5% of model heterogeneity, with a significant effect for each unit increase in survey year (F = 17.122; df = 1,10; b = 0.026%; P = .002). Extrapolating these results to 2016 suggested a current US population size of 390 adults per 100 000, or almost 1 million adults nationally. This estimate may be more indicative for younger adults, who represented more than 50% of the respondents in our analysis.
Authors' conclusions: Future national surveys are likely to observe higher numbers of transgender people. The large variety in questions used to ask about transgender identity may account for residual heterogeneity in our models. Public health implications. Under- or nonrepresentation of transgender individuals in population surveys is a barrier to understanding social determinants and health disparities faced by this population. We recommend using standardized questions to identify respondents with transgender and nonbinary gender identities, which will allow a more accurate population size estimate.
Figures


References
-
- Coleman E, Bockting W, Botzer M et al. Standards of care for the health of transsexual, transgender, and gender-nonconforming people, version 7. Int J Transgenderism. 2012;13(4):165–232.
-
- Winter S, Diamond M, Green J et al. Transgender people: health at the margins of society. Lancet. 2016;388(10042):390–400. - PubMed
-
- Grant JM, Mottet LA, Tanis J, Harrison J, Herman JL, Keisling M. Injustice at Every Turn: A Report of the National Transgender Discrimination Survey. Washington, DC: National Center for Transgender Equality and National Gay and Lesbian Task Force; 2011.
-
- Bauer GR, Hammond R, Travers R, Kaay M, Hohenadel KM, Boyce M. “I don’t think this is theoretical; this is our lives”: how erasure impacts health care for transgender people. J Assoc Nurses AIDS Care. 2009;20(5):348–361. - PubMed
Publication types
MeSH terms
Grants and funding
LinkOut - more resources
Full Text Sources
Other Literature Sources
Medical
Miscellaneous
