Comparative Study
. 2017 Jan 11;12(1):e0169923.
doi: 10.1371/journal.pone.0169923. eCollection 2017.

Comparative Analysis of Vertebrate Diurnal/Circadian Transcriptomes

Affiliations
Comparative Study

Comparative Analysis of Vertebrate Diurnal/Circadian Transcriptomes

Greg Boyle et al. PLoS One. .

Abstract

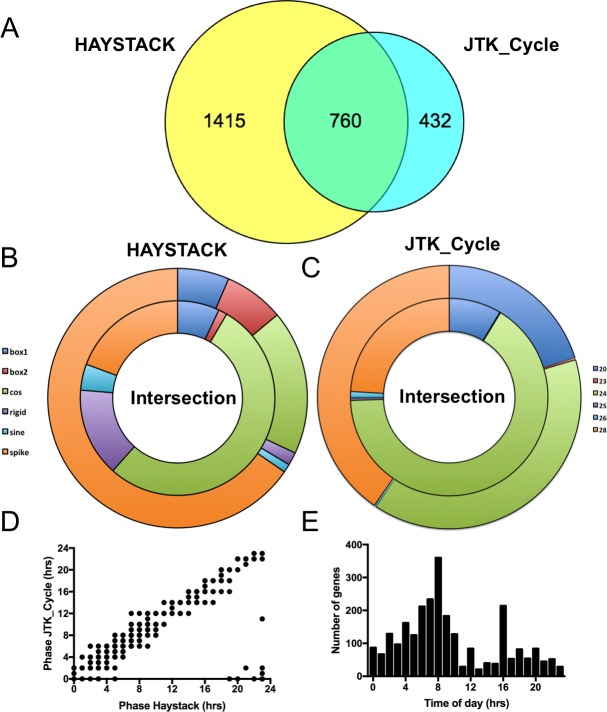
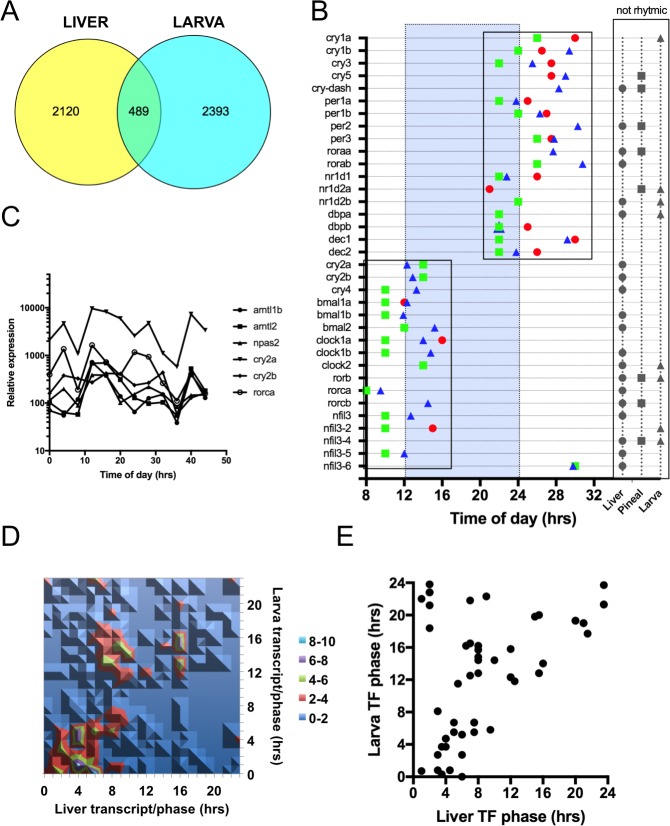
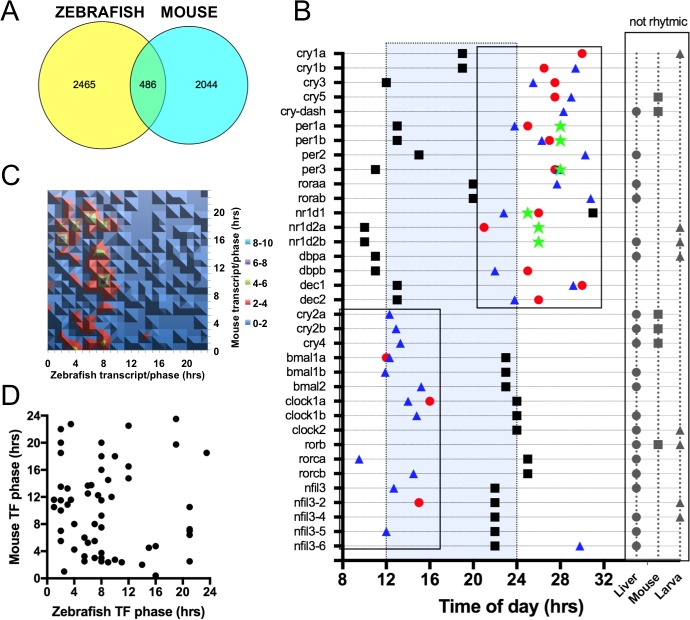
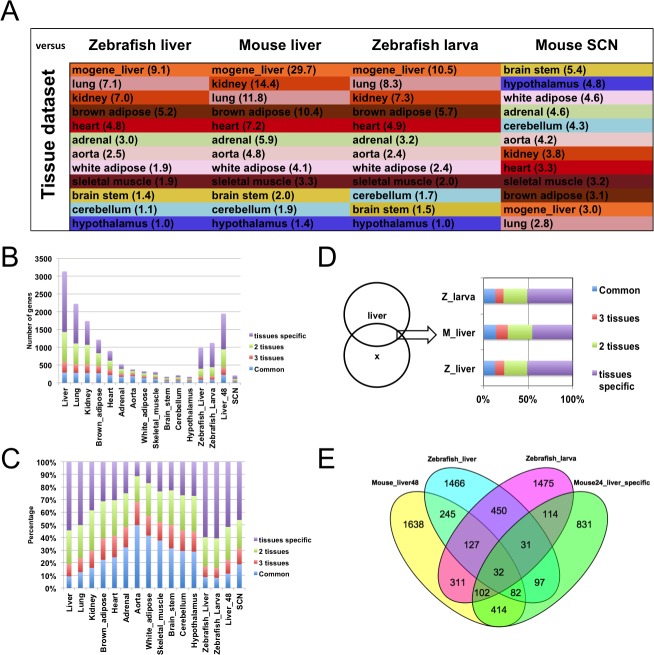
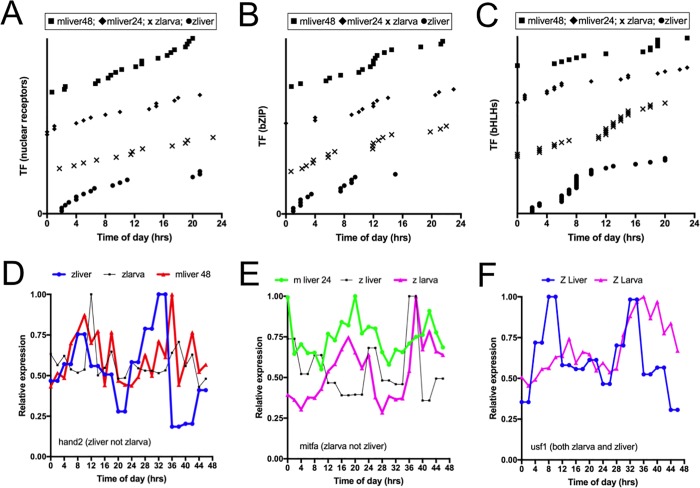
From photosynthetic bacteria to mammals, the circadian clock evolved to track diurnal rhythms and enable organisms to anticipate daily recurring changes such as temperature and light. It orchestrates a broad spectrum of physiology such as the sleep/wake and eating/fasting cycles. While we have made tremendous advances in our understanding of the molecular details of the circadian clock mechanism and how it is synchronized with the environment, we still have rudimentary knowledge regarding its connection to help regulate diurnal physiology. One potential reason is the sheer size of the output network. Diurnal/circadian transcriptomic studies are reporting that around 10% of the expressed genome is rhythmically controlled. Zebrafish is an important model system for the study of the core circadian mechanism in vertebrate. As Zebrafish share more than 70% of its genes with human, it could also be an additional model in addition to rodent for exploring the diurnal/circadian output with potential for translational relevance. Here we performed comparative diurnal/circadian transcriptome analysis with established mouse liver and other tissue datasets. First, by combining liver tissue sampling in a 48h time series, transcription profiling using oligonucleotide arrays and bioinformatics analysis, we profiled rhythmic transcripts and identified 2609 rhythmic genes. The comparative analysis revealed interesting features of the output network regarding number of rhythmic genes, proportion of tissue specific genes and the extent of transcription factor family expression. Undoubtedly, the Zebrafish model system will help identify new vertebrate outputs and their regulators and provides leads for further characterization of the diurnal cis-regulatory network.


Conflict of interest statement

The authors have declared that no competing interests exist.

Figures

Fig 1
Fig 1. Rhythmic Zebrafish liver transcripts.
(A) Venn diagram of rhythmic Zebrafish liver transcripts identified using HAYSTACK and JTK_Cycle. (B) Difference in the shape of expression profile between transcripts identified by HAYSTACK alone or by both HAYSTACK and JTK_Cycle (Intersection in Fig 1A). Shapes listed in legend are described in [9]. (C) Difference in period between transcripts identified by JTK_Cycle alone or by both HAYSTACK and JTK_Cycle (Intersection in Fig 1A). Numbers in legend correspond to period in hours. (D) Scatter plot of phase of genes identified by HAYSTACK and JTK_Cycle. (E) Rhythmic transcript count by phase of the day.
Fig 2
Fig 2. Comparison between Zebrafish larval and liver time courses.
(A) Venn diagram of the rhythmic transcripts identified in Zebrafish larva and liver. The larval genes are the common rhythmic genes from 5d old larva collected every 4hrs under LD (14:10) and DD (2882 ENSEMBL genes)[43]. (B) Expression phases of clock genes in zebrafish pineal gland, larva and liver. Red circle: liver; Green square: pineal gland (from [44]; Blue triangle: larva. Grey symbols correspond to arrhythmic genes. (C) Diurnal profiles of selected arrhythmic liver clock genes from panel B. (D) Contour plot of the 489 common cycling genes between the liver and larval time courses. Color code in legend represents the number of genes at each phase intersection. (E) Scatter plot of the phases of all cycling TF genes between the liver and larval time courses.
Fig 3
Fig 3. Comparison of Zebrafish and mouse liver rhythmic genes.
(A) Venn diagram of the rhythmic transcripts identified in Zebrafish and mouse livers. The Zebrafish liver data were converted into putative mouse ENSEMBL orthologs (2951 unique genes) and compared with the Hughes et al. dataset [10](1hr resolution for 2d in DD from CircaDB)(2530 Unique ENSEMBL genes). (B) Expression phase for clock genes in zebrafish, mouse and human. Red circle: Zebrafish liver; Blue triangle: Zebrafish larva; Black square: Mouse liver; Green star: Human hair follicle cells [51]. Grey symbols correspond to arrhythmic genes. (C). Contour plot of the 486 common cycling genes between the Zebrafish and mouse liver time courses. Color code in legend represents the number of genes at each phase intersection. (D) Scatter plot of the phase of all cycling TFs genes between the mouse and Zebrafish time courses.
Fig 4
Fig 4. Zebrafish and mouse liver rhythmic genes compared to 12 mouse tissue time courses.
(A) Color-coded table displaying the ranking from highest to lowest of the Tanimoto-Jaccard index from the comparison of the Zebrafish or Mouse liver time courses against 12 different tissues time courses from Zhang et al. [12]. As controls, Zebrafish larval and Mouse SCN datasets were also compared with the 12 tissues ensemble. (B) Number of common (present in 4 to 12 tissues) or tissue specific genes (present in 1 to 3 tissues) in the 12 tissues and surveyed datasets. (C) Proportion of common (present in 4 to 12 tissues) or tissue specific genes (present in 1 to 3 tissues) in the 12 tissues and surveyed datasets. (D) Proportion of common (present in 4 to 12 tissues) or tissue specific genes (present in 1 to 3 tissues) in the intersection of the Venn diagram between the mouse liver and the Zebrafish larval, liver or Mouse liver (Liver_48) time courses. (E) Venn diagram between the complete mouse liver (Liver_48), Zebrafish liver and larval datasets and the liver specific subset from the mouse liver in [12].
Fig 5
Fig 5. E box, D box and RRE regulator phases in mouse liver and Zebrafish tissues.
(A) Phase of rhythmic nuclear receptor transcripts expressed in the mouse liver. 1hr sampling rate time course: mliver48, 2hr sampling rate mouse liver time course: mliver24, Zebrafish larval and liver time courses: zlarva and zliver. (B) Phase of rhythmic bZIP transcripts expressed in same datasets as Fig 5A. (C) Phase of rhythmic bHLH transcripts expressed in same datasets as Fig 5A. (D) hand2 transcript profile in mouse liver and Zebrafish liver and larva. (E) mitfa transcript profile in mouse liver and Zebrafish liver and larva. (F) usf1 transcript profile in Zebrafish liver and larva.

References

    1. Williams GE. Geological constraints on the Precambrian history of Earth“s rotation and the Moon”s orbit. Reviews of Geophysics. 2000.
    1. Takahashi JS. Molecular components of the circadian clock in mammals. Diabetes Obes Metab. Blackwell Publishing Ltd; 2015;17 Suppl 1: 6–11. - PMC - PubMed
    1. Patel VR, Eckel-Mahan K, Sassone-Corsi P, Baldi P. How pervasive are circadian oscillations? Trends in Cell Biology. 2014;24: 329–331. 10.1016/j.tcb.2014.04.005 - DOI - PMC - PubMed
    1. Dibner C, Schibler U, Albrecht U. The mammalian circadian timing system: organization and coordination of central and peripheral clocks. Annu Rev Physiol. 2010;72: 517–549. 10.1146/annurev-physiol-021909-135821 - DOI - PubMed
    1. Atamian HS, Creux NM, Brown EA, Garner AG, Blackman BK, Harmer SL. Circadian regulation of sunflower heliotropism, floral orientation, and pollinator visits. Science. American Association for the Advancement of Science; 2016;353: 587–590. 10.1126/science.aaf9793 - DOI - PubMed

Publication types