. 2017 Jan 11;12(1):e0170076.
doi: 10.1371/journal.pone.0170076. eCollection 2017.

Role for Egr1 in the Transcriptional Program Associated with Neuronal Differentiation of PC12 Cells

Affiliations

Role for Egr1 in the Transcriptional Program Associated with Neuronal Differentiation of PC12 Cells

Kenneth W Adams et al. PLoS One. .

Abstract

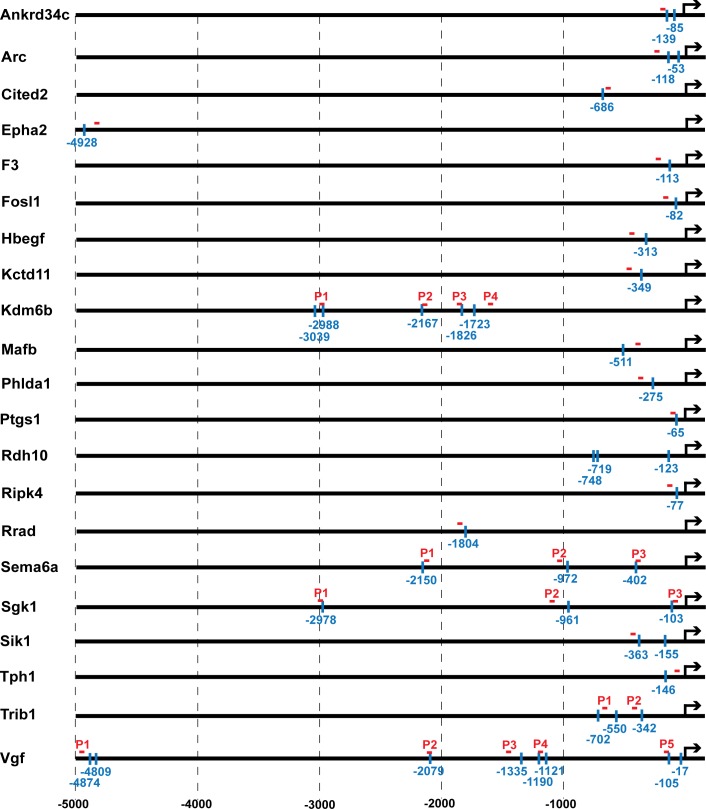
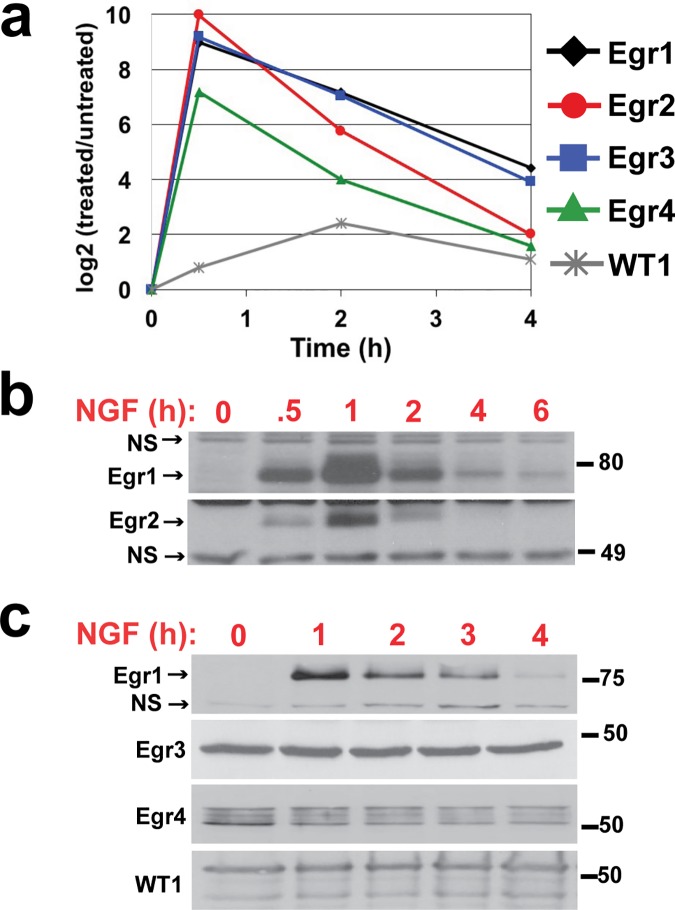
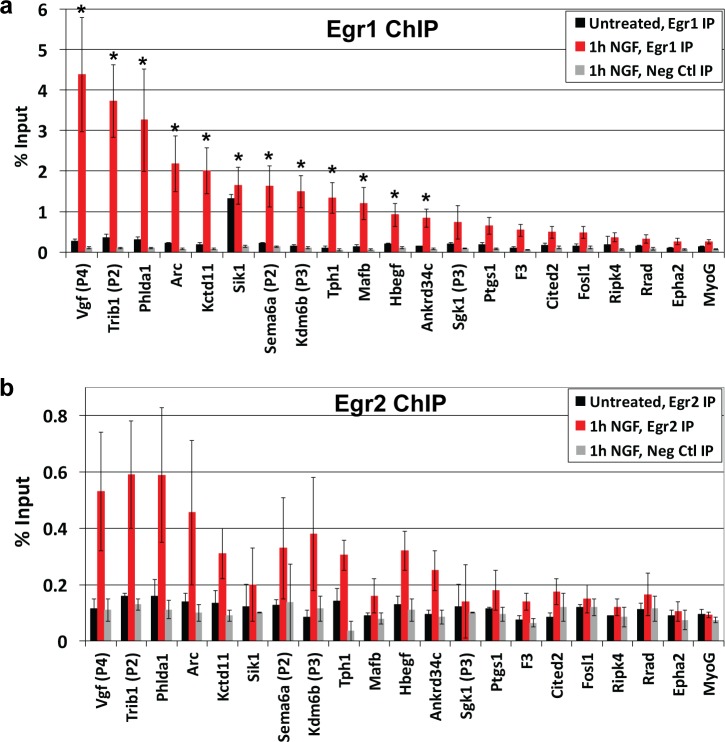
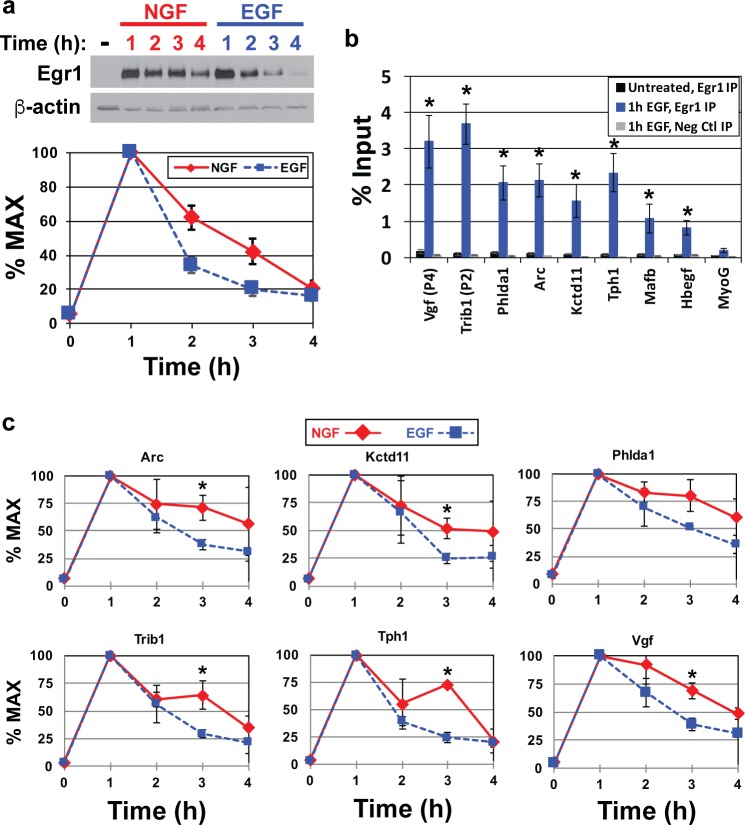
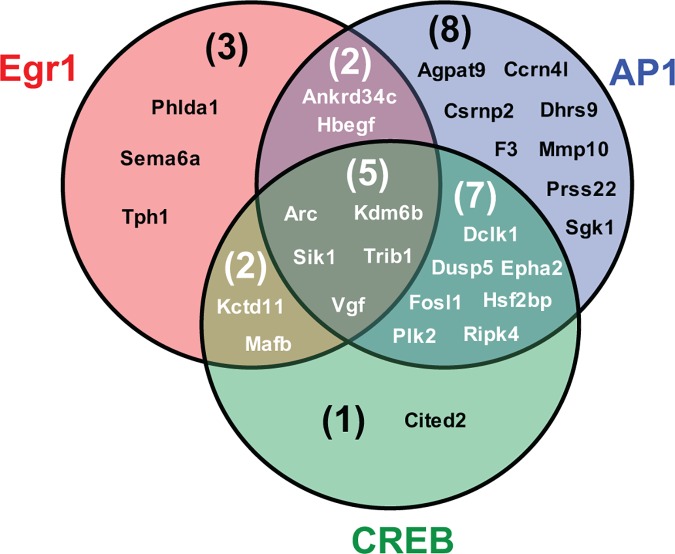
PC12 cells are a well-established model to study how differences in signal transduction duration can elicit distinct cell behaviors. Epidermal growth factor (EGF) activates transient ERK signaling in PC12 cells that lasts 30-60 min, which in turn promotes proliferation; nerve growth factor (NGF) activates more sustained ERK signaling that lasts 4-6 h, which in turns induces neuronal differentiation. Data presented here extend a previous study by Mullenbrock et al. (2011) that demonstrated that sustained ERK signaling in response to NGF induces preferential expression of a 69-member gene set compared to transient ERK signaling in response to EGF and that the transcription factors AP-1 and CREB play a major role in the preferential expression of several genes within the set. Here, we examined whether the Egr family of transcription factors also contributes to the preferential expression of the gene set in response to NGF. Our data demonstrate that NGF causes transient induction of all Egr family member transcripts, but a corresponding induction of protein was detected for only Egr1 and 2. Chromatin immunoprecipitation experiments provided clearest evidence that, after induction, Egr1 binds 12 of the 69 genes that are preferentially expressed during sustained ERK signaling. In addition, Egr1 expression and binding upstream of its target genes were both sustained in response to NGF versus EGF within the same timeframe that its targets are preferentially expressed. These data thus provide evidence that Egr1 contributes to the transcriptional program activated by sustained ERK signaling in response to NGF, specifically by contributing to the preferential expression of its target genes identified here.


Conflict of interest statement

The authors have declared that no competing interests exist.

Figures

Fig 1
Fig 1. Predicted Egr binding sites and ChIP primer locations upstream of genes preferentially expressed during sustained ERK signaling in response to NGF.
Of the 69 genes that Mullenbrock et al. (2011) determined are preferentially expressed during sustained ERK signaling in response to NGF, 21 contained putative Egr binding sites within 5 kb upstream of their transcription start site (TSS). The locations of each Egr binding site are denoted by the vertical blue lines. The red horizontal lines denote the relative locations of primer sets used for real time PCR to detect Egr binding to nearby Egr binding site(s). For genes with multiple dispersed Egr binding sites, multiple primers sets were designed (denoted P1, P2, etc.) to detect Egr binding to the nearest predicted Egr binding site.
Fig 2
Fig 2. Time course analysis of Egr family expression following NGF treatment.
PC12 cell cultures were treated with 50 ng/ml NGF for 0–4 h before harvest. (a) Total RNA was extracted and subjected to real-time RT-PCR to quantify changes in mRNA levels or (b) total cell lysates were prepared and subjected to SDS-PAGE and Western blot analysis to evaluate changes in protein levels. NS, nonspecific band.
Fig 3
Fig 3. ChIP analysis to evaluate binding of Egr1 and Egr2 upstream of genes with predicted Egr binding sites.
PC12 cultures were treated with or without 50 ng/ml NGF for 1 h and subjected to ChIP assay using antibodies against Egr1, Egr2, or an IgG control. Real-time PCR was then conducted on the immunoprecipitated DNA using primers within 250 bp of each predicted Egr binding site (see Fig 1 and S2 Table for primer locations and sequences). For genes with multiple dispersed Egr binding sites, multiple primer sets (denoted P1, P2, etc.) were used; only data for the set that detected highest level of binding are included here (see S1 Fig for data from the remaining primer sets). Primers to amplify a region approximately 100 bp upstream of the Myog gene were used as a negative control for Egr1 binding. (a) Data from Egr1 ChIP are plotted as % input and are averages from three to four independent experiments ± S.E. *, One-tailed Student’s t tests were conducted comparing the % input value for Myog after Egr1 IP to the % input values for each predicted Egr target after Egr1 IP, which yielded p values ≤ 0.05 for 12 predicted Egr targets. (b) Data from Egr2 ChIP are plotted as % input and are averages from two independent experiments ± S.E.
Fig 4
Fig 4. Sustained Egr1 expression and binding upstream of target genes in response to NGF versus EGF.
(a) PC12 cell cultures were treated with 50 ng/ml NGF or 25 ng/ml EGF for 0–4 h. Total cell lysates were harvested and subjected to SDS-PAGE and Western blot for Egr1. Egr1 levels were quantified by densitometry and converted to % maximum levels for ten independent experiments and plotted (average ± S.E.). (b) PC12 cultures were treated with or without 25 ng/ml EGF for 1 h and subjected to ChIP assay using antibodies against Egr1 or an IgG control. Real-time PCR was then conducted on the immunoprecipitated DNA using primers within 250 bp of predicted Egr binding sites (see Fig 1 and S2 Table for primer locations and sequences). Primers to amplify a region approximately 100 bp upstream of the Myog gene were used as a negative control for Egr1 binding. Data are plotted as % input and are averages from three to six independent experiments ± S.E. *, One-tailed Student’s t tests were conducted comparing the % input value for Myog after Egr1 IP to the % input values for each predicted Egr target after Egr1 IP, which yielded p values ≤ 0.05. (c) PC12 cell cultures were treated with 50 ng/ml NGF or 25 ng/ml EGF for 0–4 h and subjected to ChIP with anti-Egr1 antibody. Immunoprecipitated DNA was then subjected to real-time PCR with primers to detect Egr1 binding to a subset of its target genes, which was quantified as % input. Percent input values were then converted into % maximum values, which were plotted. *, One-tailed Student’s t tests were conducted comparing the % input values at each time point after NGF versus EGF treatment, which yielded p values ≤ 0.05 at the 3-hour time point for Arc, Kctd11, Trib1, Tph1, and Vgf.
Fig 5
Fig 5. AP-1, CREB, and Egr1 cooperatively regulate 28 genes during their preferential expression in response to NGF and sustained ERK signaling.
The Venn diagram summarizes genes bound by AP-1, CREB, and/or Egr1 during their preferentially expression in response to NGF and sustained ERK signaling, as detected by Mullenbrock et al. (2011) and the present study.

Similar articles

Cited by

References

    1. Greene LA, Tischler AS. Establishment of a noradrenergic clonal line of rat adrenal pheochromocytoma cells which respond to nerve growth factor. Proceedings of the National Academy of Sciences of the United States of America. 1976;73(7):2424–8. Epub 1976/07/01. PubMed Central PMCID: PMC430592. - PMC - PubMed
    1. Segal RA, Greenberg ME. Intracellular signaling pathways activated by neurotrophic factors. Annual review of neuroscience. 1996;19:463–89. 10.1146/annurev.ne.19.030196.002335 - DOI - PubMed
    1. Szeberenyi J, Cai H, Cooper GM. Effect of a dominant inhibitory Ha-ras mutation on neuronal differentiation of PC12 cells. Molecular and cellular biology. 1990;10(10):5324–32. PubMed Central PMCID: PMC361225. - PMC - PubMed
    1. Klesse LJ, Meyers KA, Marshall CJ, Parada LF. Nerve growth factor induces survival and differentiation through two distinct signaling cascades in PC12 cells. Oncogene. 1999;18(12):2055–68. 10.1038/sj.onc.1202524 - DOI - PubMed
    1. Pang L, Sawada T, Decker SJ, Saltiel AR. Inhibition of MAP kinase kinase blocks the differentiation of PC-12 cells induced by nerve growth factor. The Journal of biological chemistry. 1995;270(23):13585–8. - PubMed

MeSH terms