

iPSC-Derived Retina Transplants Improve Vision in rd1 End-Stage Retinal-Degeneration Mice
- PMID: 28076757
- PMCID: PMC5233464
- DOI: 10.1016/j.stemcr.2016.12.008
iPSC-Derived Retina Transplants Improve Vision in rd1 End-Stage Retinal-Degeneration Mice
Erratum in
-
iPSC-Derived Retina Transplants Improve Vision in rd1 End-Stage Retinal-Degeneration Mice.Stem Cell Reports. 2017 Feb 14;8(2):489. doi: 10.1016/j.stemcr.2017.01.018. Stem Cell Reports. 2017. PMID: 28199830 Free PMC article. No abstract available.
-
iPSC-Derived Retina Transplants Improve Vision in rd1 End-Stage Retinal-Degeneration Mice.Stem Cell Reports. 2017 Apr 11;8(4):1112-1113. doi: 10.1016/j.stemcr.2017.03.024. Stem Cell Reports. 2017. PMID: 28402835 Free PMC article. No abstract available.
Abstract
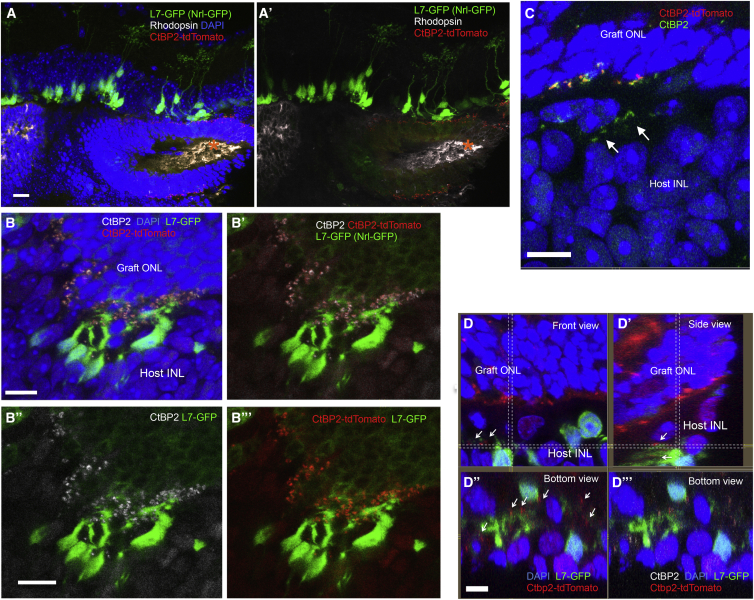
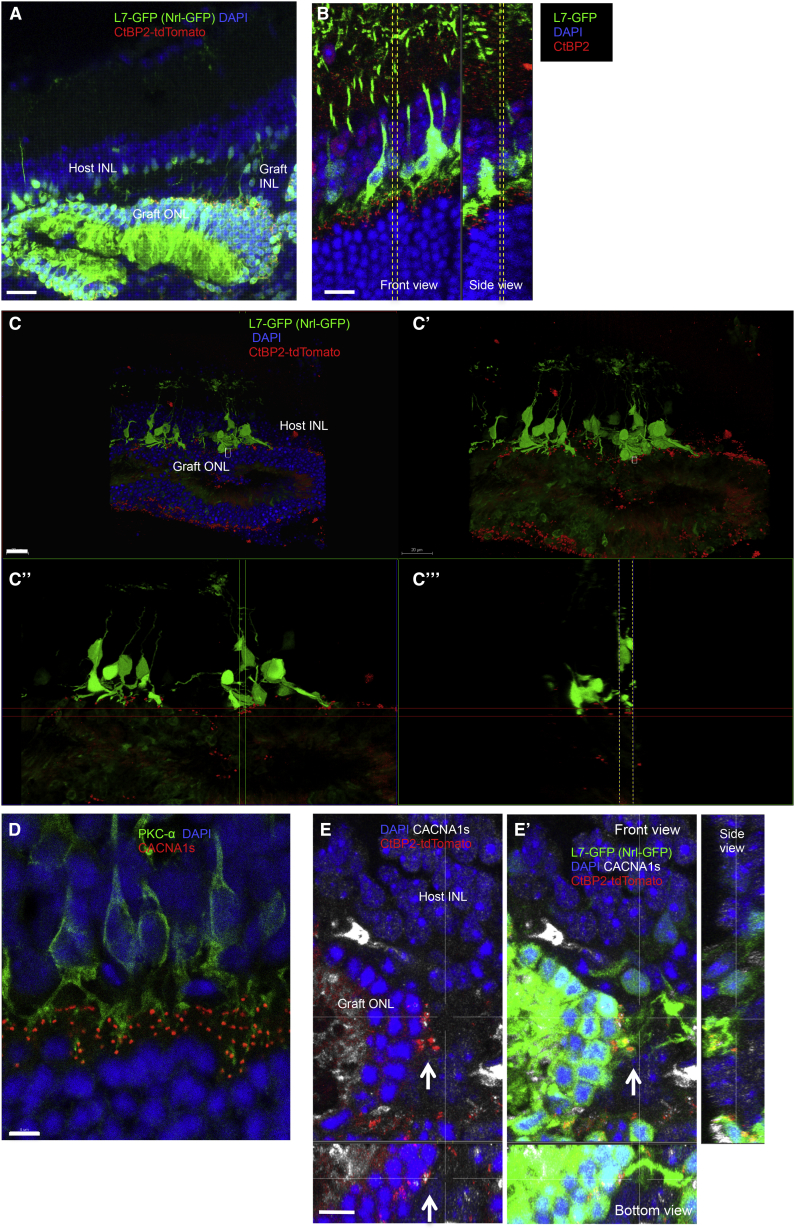
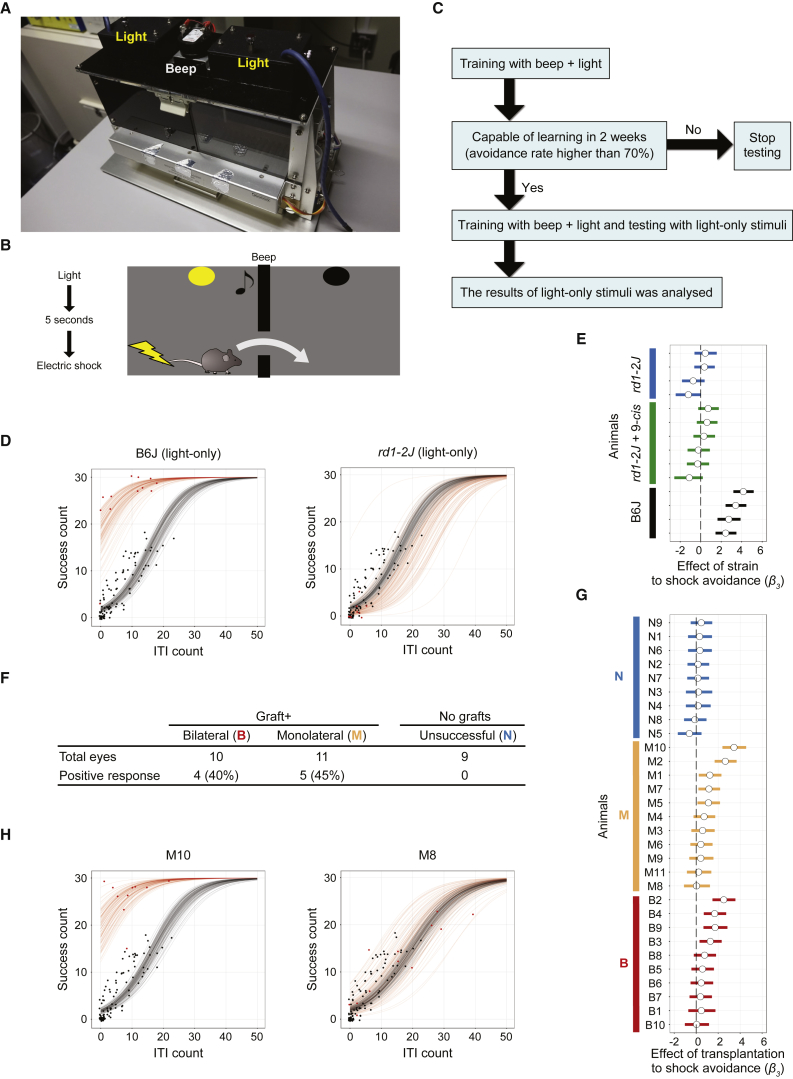
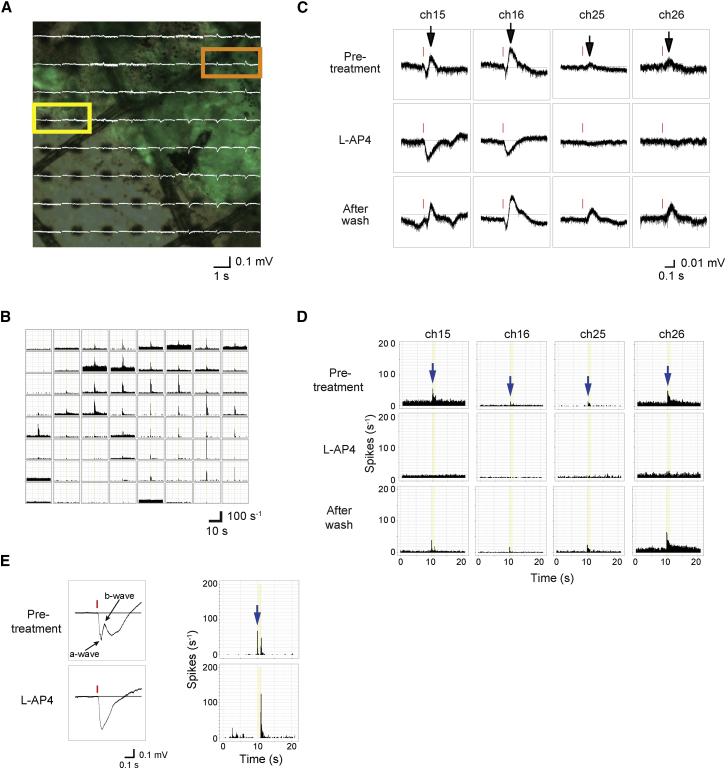
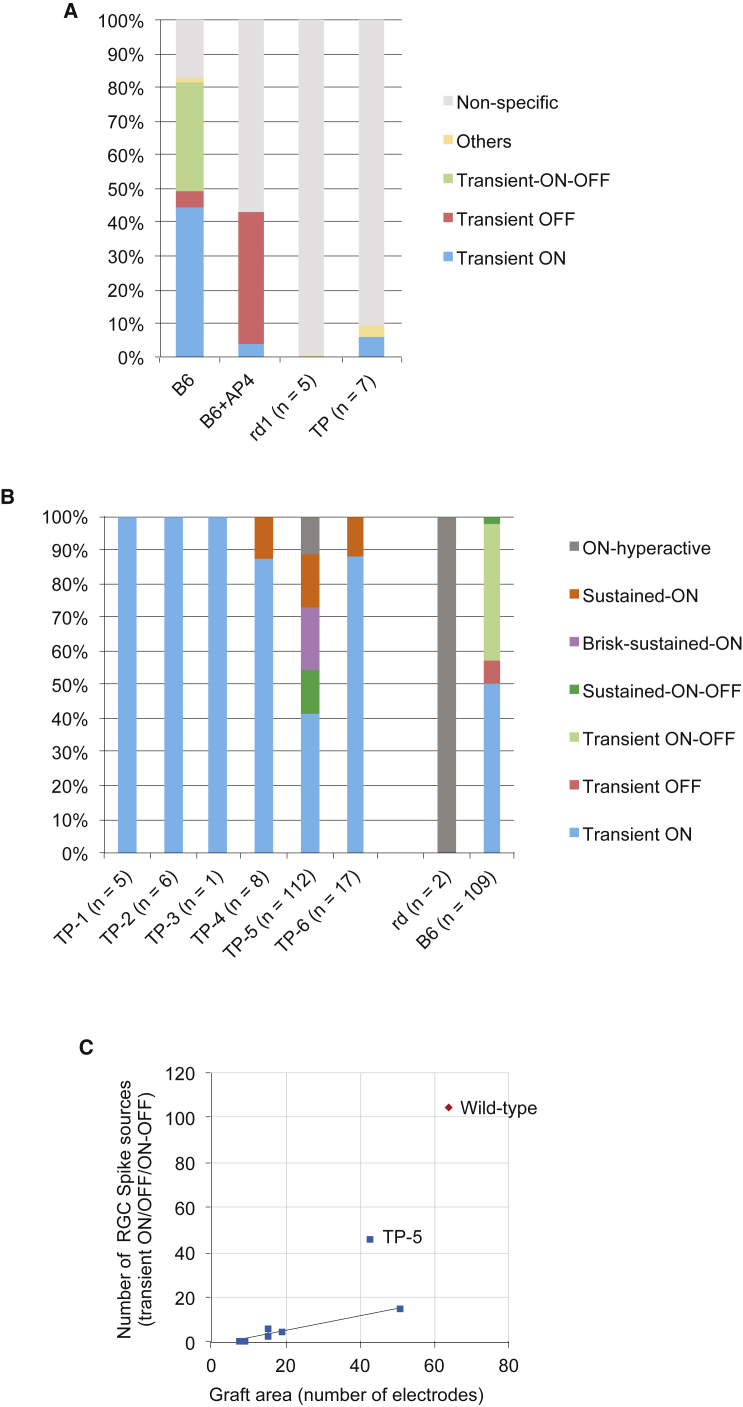
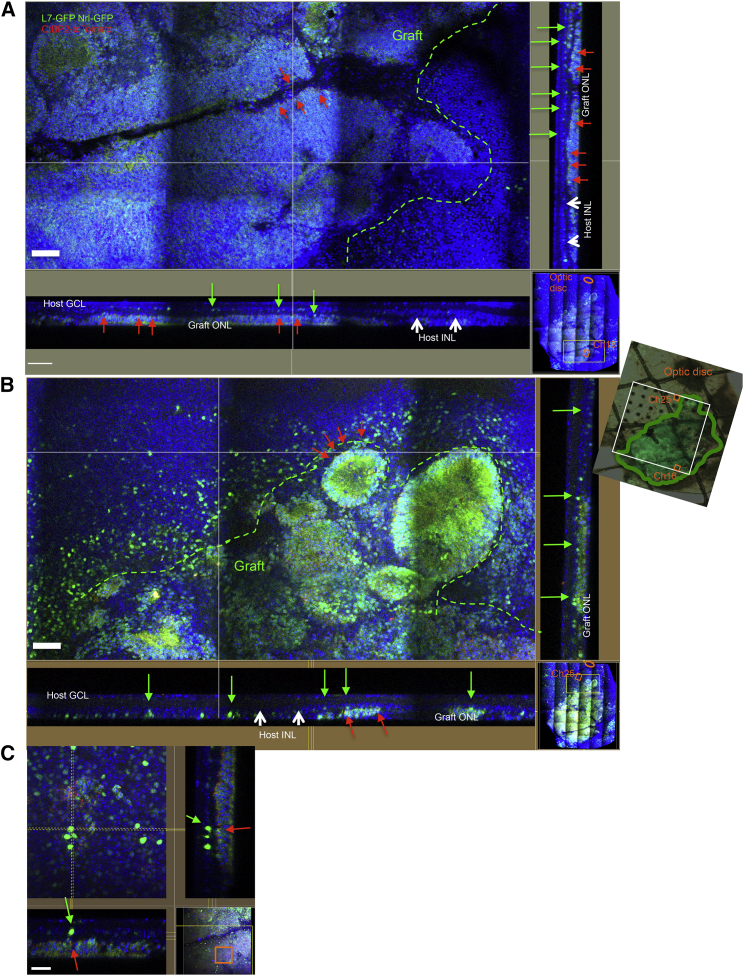
Recent success in functional recovery by photoreceptor precursor transplantation in dysfunctional retina has led to an increased interest in using embryonic stem cell (ESC) or induced pluripotent stem cell (iPSC)-derived retinal progenitors to treat retinal degeneration. However, cell-based therapies for end-stage degenerative retinas that have lost the outer nuclear layer (ONL) are still a big challenge. In the present study, by transplanting mouse iPSC-derived retinal tissue (miPSC retina) in the end-stage retinal-degeneration model (rd1), we visualized the direct contact between host bipolar cell terminals and the presynaptic terminal of graft photoreceptors by gene labeling, showed light-responsive behaviors in transplanted rd1 mice, and recorded responses from the host retina with transplants by ex vivo micro-electroretinography and ganglion cell recordings using a multiple-electrode array system. Our data provides a proof of concept for transplanting ESC/iPSC retinas to restore vision in end-stage retinal degeneration.
Keywords: iPSC; multiple electrode array; photoreceptor transplantation; retinal degeneration; retinal regeneration; shuttle-avoidance test.
Copyright © 2017 The Authors. Published by Elsevier Inc. All rights reserved.
Figures
Similar articles
-
Medium- to long-term survival and functional examination of human iPSC-derived retinas in rat and primate models of retinal degeneration.EBioMedicine. 2019 Jan;39:562-574. doi: 10.1016/j.ebiom.2018.11.028. Epub 2018 Nov 28. EBioMedicine. 2019. PMID: 30502055 Free PMC article.
-
Establishment of Immunodeficient Retinal Degeneration Model Mice and Functional Maturation of Human ESC-Derived Retinal Sheets after Transplantation.Stem Cell Reports. 2018 Mar 13;10(3):1059-1074. doi: 10.1016/j.stemcr.2018.01.032. Epub 2018 Mar 1. Stem Cell Reports. 2018. PMID: 29503091 Free PMC article.
-
Grafted c-kit+/SSEA1- eye-wall progenitor cells delay retinal degeneration in mice by regulating neural plasticity and forming new graft-to-host synapses.Stem Cell Res Ther. 2016 Dec 30;7(1):191. doi: 10.1186/s13287-016-0451-8. Stem Cell Res Ther. 2016. PMID: 28038685 Free PMC article.
-
Pluripotent stem cell-derived retinal organoid/cells for retinal regeneration therapies: A review.Regen Ther. 2023 Jan 5;22:59-67. doi: 10.1016/j.reth.2022.12.005. eCollection 2023 Mar. Regen Ther. 2023. PMID: 36712956 Free PMC article. Review.
-
Organoid technology for retinal repair.Dev Biol. 2018 Jan 15;433(2):132-143. doi: 10.1016/j.ydbio.2017.09.028. Epub 2017 Dec 25. Dev Biol. 2018. PMID: 29291970 Review.
Cited by
-
Cellular and circuit remodeling of the primate foveal midget pathway after acute photoreceptor loss.Proc Natl Acad Sci U S A. 2024 Sep 10;121(37):e2413104121. doi: 10.1073/pnas.2413104121. Epub 2024 Sep 4. Proc Natl Acad Sci U S A. 2024. PMID: 39231211 Free PMC article.
-
Multiple Invagination Patterns and Synaptic Efficacy in Primate and Mouse Rod Synaptic Terminals.Invest Ophthalmol Vis Sci. 2022 Jul 8;63(8):11. doi: 10.1167/iovs.63.8.11. Invest Ophthalmol Vis Sci. 2022. PMID: 35819284 Free PMC article.
-
Reproducibility and staging of 3D human retinal organoids across multiple pluripotent stem cell lines.Development. 2019 Jan 9;146(1):dev171686. doi: 10.1242/dev.171686. Development. 2019. PMID: 30567931 Free PMC article.
-
Repair of Retinal Degeneration following Ex Vivo Minicircle DNA Gene Therapy and Transplantation of Corrected Photoreceptor Progenitors.Mol Ther. 2020 Mar 4;28(3):830-844. doi: 10.1016/j.ymthe.2020.01.023. Epub 2020 Jan 29. Mol Ther. 2020. PMID: 32027843 Free PMC article.
-
Vitamin C- and Valproic Acid-Induced Fetal RPE Stem-like Cells Recover Retinal Degeneration via Regulating SOX2.Mol Ther. 2020 Jul 8;28(7):1645-1657. doi: 10.1016/j.ymthe.2020.04.008. Epub 2020 Apr 16. Mol Ther. 2020. PMID: 32353323 Free PMC article.
References
-
- Berson D.M., Dunn F.A., Takao M. Phototransduction by retinal ganglion cells that set the circadian clock. Science. 2002;295:1070–1073. - PubMed
-
- del Cerro M., Humayun M.S., Sadda S.R., Cao J., Hayashi N., Green W.R., del Cerro C., de Juan E. Histologic correlation of human neural retinal transplantation. Invest. Ophthalmol. Vis. Sci. 2000;41:3142–3148. - PubMed
Publication types
MeSH terms
LinkOut - more resources
Full Text Sources
Other Literature Sources
Molecular Biology Databases
